In this exercise, you will make a slightly different type of H-R diagram. Instead of graphing absolute magnitude vs. b-v color, you will graph absolute magnitude vs. spectral type. Looking at a star’s spectral type – defined by the peaks and valleys in its spectrum – is an another way of finding the star’s temperature. See the Spectral Types project for more information
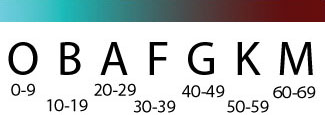
To use the spectral types classification in Excel, you will need to convert the spectral type’s letter-number designation into a number. The temperature order of spectral types, from hottest to coolest, is OBAFGKM. There are also spectral subtypes 0 – 9 for each type. Let spectral type O be the digits 0 – 9, B be 10 – 19, A be 20 – 29, and so on. For example, if you had a G2 star (like our Sun) you would enter 42.
Exercise 2. Make an H-R diagram for the closest stars. Spectral type and absolute magnitude data for the 26 nearest stars can be found here. (Note: There are some spectral type D stars in the list. You may ignore these for now.)
Question 6. How does this diagram differ from the diagram for the brightest stars?
Question 7. How does our Sun compare to the other stars in our neighborhood?
The H-R diagram of the nearest stars looks different from the H-R diagram of the brightest stars. Most nearby stars are small and faint, while most of the brightest stars are large and bright. What would happen if you combined the two types of stars into a single H-R diagram?
A Schematic H-R Diagram
If you could look at all the stars within a large region of space – the large, bright stars you saw in Exercise 1 and the small, faint stars you saw in Exercise 2 – you could get an H-R diagram with a representative sample of stars. The H-R diagram you would make would look like the schematic diagram below:
The schematic H-R diagram shows four groups of stars. The narrow band across the center is the “main sequence” of stars, which contains about 90% of stars. Main sequence stars are normal hydrogen-burning stars like our Sun. A star’s position along the main sequence is determined entirely by its mass. Bigger stars are hotter and brighter – class O stars can have 60-100 times the Sun’s mass. Smaller stars are cooler and dimmer – class M stars can have one-tenth the Sun’s mass. When you made the H-R diagram of the nearest stars, you saw only main sequence stars.
The stars above and to the right of the main sequence are giant and supergiant stars – older stars that have run out of hydrogen, and now burn heavier elements. When you made the H-R diagram of the brightest stars, you saw mostly giant and supergiant stars.
The stars below and to the left of the main sequence are white dwarfs – giant stars that ran out of all their nuclear fuel and collapsed. They glow hot because of the energy left over from their collapse. You did not see any white dwarfs in your two H-R diagrams because they are very faint and hard to detect. The nearest white dwarf is Sirius B, which orbits the bright star Sirius. Sirius B is about 8.6 light-years away and has an apparent magnitude of about 8.5.