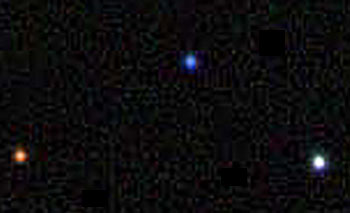
Take a look again at the three stars from the last page, shown at the right. What colors are the three stars? Are they red, blue, and white? Or are they orange, turquoise, and cream? What about burnt siena, cerulean, and periwinkle?
Clearly, “color” as we usually think about it is a subjective idea. What one person’s calls “blue,” for example, might be totally different from what another person calls blue. If astronomers are going to learn anything about a star from its color, they first need to have a definition of color that everyone can agree on – a single measurement that anyone can make to compare the colors of different stars.
In the next Explore exercise, you will look through stars in SkyServer’s database to try to find an objective, mathematical definition of color.
Explore 1. Look through SkyServer’s database and find several stars whose colors appear different. Find some blue stars, some red stars, some yellow stars, and some white stars.
To search through the stars, you will use SkyServer’s Navigation tool. Click the link below to launch the tool. The tool will open in a new window, which will show a part of the sky. Use the Zoom buttons (the magnifying glasses and blue rectangles) to zoom in our out. Use the NWSE buttons to move around to different parts of the sky.
Click on a star to see its data. The data will appear in a box on the right side of the window – “ra” and “dec” give the star’s position, “type” tells you whether it is a star or a galaxy, and u,g,r,i, and z are the star’s “magnitudes.” You’ll learn more about magnitudes later; for now, you’ll search for patterns in the magnitudes.
When you find a star you are interested in, record its data in this Excel workbook. Record its position (RA and Dec), color, and its five magnitudes (u,g,r,i,z). Record data for 10-15 stars. You will use these data in the next activity.
The workbook is an Excel spreadsheet. If you do not have Excel, you can open it with Google Spreadsheets.
Explore 2. Now, see if you can discover a pattern in the colors.
Look at the data you have saved in your workbook. The directions here tell you how to analyze the data in Excel; to analyze the data in other graphing programs, you would follow similar steps. Click on the first row of data, then use the tab or right arrow key to move the highlighted box to the column to the right of your data. Type the color of the first star and hit enter. Repeat this process to type in the colors of all the stars you found.
Now, click on one of the cells in your spreadsheet and select Sort from the Data menu. Sort by u in ascending order. Do you see the colors group into any patterns? Repeat the sort by g, r, i, and z. Do you see any patterns now?
Next, create another column to the right of the colors. Label this column u-g. Click on the u-g column for the row for the first star. Type an equal (=) sign. Click on the box with the first star’s u value. Type a minus (-) sign. Click on the box with the first star’s g value. Press enter. Then, click the small square in the lower right corner of the cell you just entered and drag down to the last row of data. Excel will automatically repeat the subtraction for the other stars.
Repeat this procedure to get columns for g-r, r-i, and i-z. Now, sort the data by u-g, g-r, r-i, and i-z. What patterns do you see now? What column of data gives you the clearest pattern?