SDSS Spectra
The SDSS records two main types of data: photometric and spectroscopic. Preflight training in Types of SDSS Data explains in detail how photometric (imaging) and spectroscopic data are captured, recorded, and accessed in the database. In this training session we look in detail at spectroscopic data, and learn what they tell us about objects in both the nearby and distant universe.
What is a spectrum?
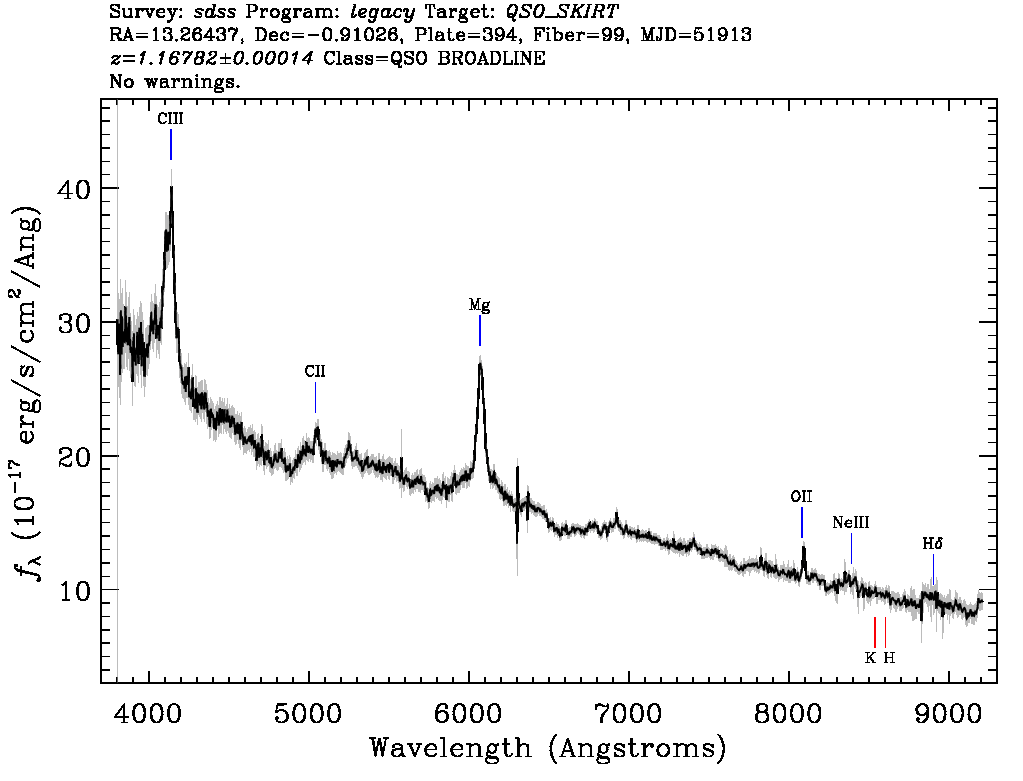
A spectrograph spreads out the light from an object into a “rainbow” and measures the amount of light emitted at different wavelengths. A spectrum graph like the one shown to the right provides a measurement of the intensity of light (on the vertical axis) as a function of wavelength (shown along the horizontal axis). Smaller values of wavelength correspond to higher-energy photons and bluer colors. Correspondingly, larger values of wavelength indicate redder colors and lower-energy photons.
A note on units: Ground-based astronomers tend to measure the wavelengths of observed light in units of nanometers (one billionth of a meter) or Angstroms (one ten-billionth of a meter). The intensity of light in each wavelength bin, which is plotted along the vertical axis, is measured in more complicated units. The technical term for this intensity is flux: the amount of light that is collected in a given amount of time, over the collecting area of the detector. Flux is generally measured in units of energy (ergs) per unit time (seconds) per unit area (square centimeters) per resolution element of the wavelength range (Angstroms).
What does a spectrum tell us?
When you take an image of a nearby object, its shape, color, and brightness can be used to determine its type (e.g., a star vs. a galaxy) and its general physical characteristics. As we try to observe increasingly more distant objects, they appear smaller and smaller in images, and it becomes increasingly more difficult to determine their identifying physical properties from an image alone.
The three primary types of objects targeted by the SDSS (stars, galaxies, and quasars) can be easily differentiated by the features of their spectra. For example, the two objects shown below look nearly identical in their images. It’s only when we take a spectrum of each that we can see that they are entirely different types of objects: Object #1 is a star in our own galaxy, and Object #2 is a quasar 26 billion light years away!
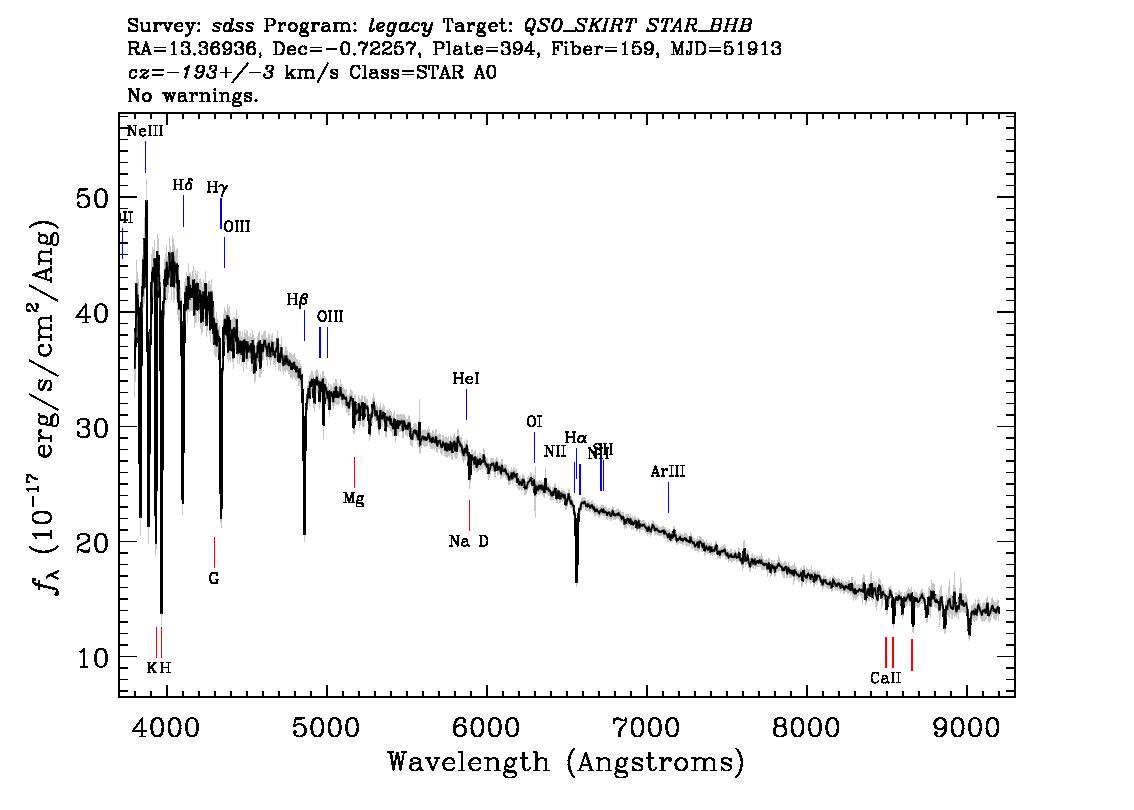
As you can see, without spectroscopic observations, it would be nearly impossible to tell which objects in the images are nearby stars, and which are distant quasars. Measuring the spectrum of an object also enables us to determine an object’s distance from Earth and to measure other physical properties of interest, such as its mass, age, composition, and velocity.
Features of Emission and Absorption
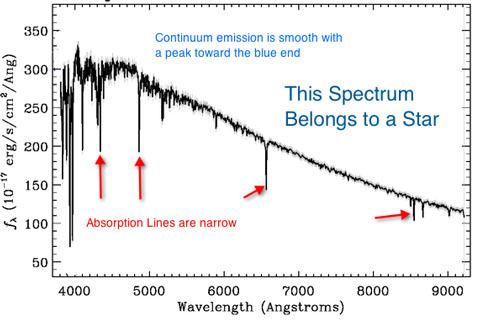
Stars are one type of object that produce a continuous spectrum, meaning some light is emitted at all wavelengths. The continuum emission of stars approximate thermal emitters (i.e., blackbodies), which produce a smooth continuous spectrum with a characteristic shape.
In reality, none of the spectra in the SDSS are perfectly smooth. They all have spikes and dips which can be used to understand the type and composition of the object, its location, and other physical characteristics. The spikes in a spectrum are referred to as emission lines and the dips are referred to as absorption lines. The overall shape of an object’s spectrum is referred to as the continuum.
When you look at a spectrum, you might ask yourself:
- What is the shape of the continuum?
- Which features are present?
- Are the emission and/or absorption lines large or small? Broad or narrow?
- At what wavelengths are emission or absorption features found in the spectrum?
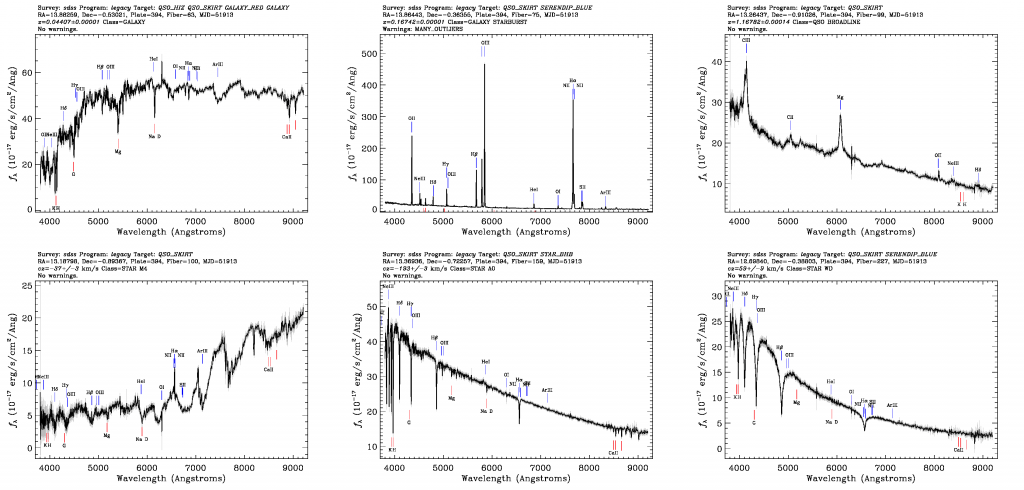
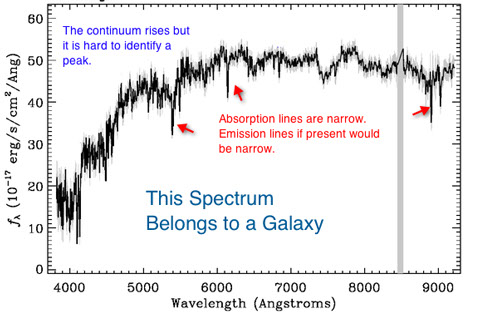
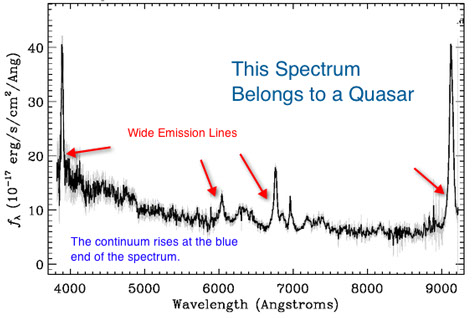
Each of the three main types of objects found in the SDSS (stars, galaxies, and quasars) has been identified by its spectral features. Look at the spectra below. Note the features you see and then click on the image to see how you did.

You have observed that some objects have emission lines in their spectra, others have absorption lines, and others have a combination of each.
- Emission lines represent additional light emitted at specific wavelengths by hot or excited gas, which radiates light at specific wavelengths that indicate its composition.
- Absorption lines are wavelengths where light has been absorbed (removed from the observed spectrum) by gas or dust that lies in between us and the source. The pattern of wavelengths seen in absorption are used to determine the composition of the absorbing material.
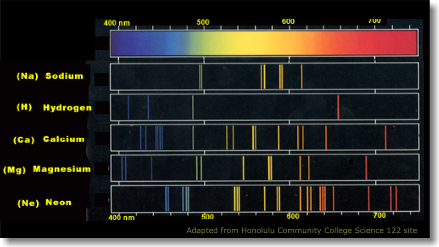
Every element in the universe emits a characteristic combination of light when excited. The pattern of wavelengths where light is emitted or absorbed reveals the chemical composition of the object that produced it. The picture on the left shows just a few examples.
For more information about how atoms absorb and emit particular wavelengths of light we recommend this spectroscopy resource from the University of Arizona.
Want to learn more?
To learn more about how the shape of a star’s blackbody spectrum relates to its temperature, and the physics behind absorption and emission lines in astronomical spectra, we recommend the pages on Continuous Spectra and Discrete Spectra at Nick Strobel’s Astronomy Notes.
We also invite you to explore the spectra of stars in our Voyages activities:
More information about the spectra of quasars can be found in our activity:
To learn more about how the location of emission and absorption features in an object’s spectrum is used to measure a “redshift” and infer its distance, please see our activity: