Hubble Humason 1936 Redshift Magnitude Relationship 
NGSS Connections
Supports PE HS-ESS1-2 : Earth’s Place in the Universe
Supports DCI ESS1.A: The Universe and Its Stars, PS4.A Wave Properties
Engages in SEP 3:Planning and carrying out investigations, 4:Analyzing and interpreting data,5:Using mathematics and computational thinking, and CCC 1:Patterns, 6:Structure and function: The motion and make up of stars and galaxies provide evidence for the Big Bang theory.
We continue our Expedition tracing the historic research that established the relationship between redshift and distance by constructing a graph of velocity versus magnitude using the data for the Abell clusters. The 1936 redshift-magnitude relationship from Hubble and Humason’s original paper is reproduced below. This plots velocity on the y-axis and magnitude on the x-axis for the named clusters of galaxies. The relationship looks linear.
In a bit more detail, the velocity is in units of km/sec and is derived by multiplying the measured redshift (z) by the speed of light (c). The equation looks like this: (v = c z). In each cluster, the plotted value for the velocity is the average of the number of galaxies given in parentheses. The magnitude is labeled mpg. (The subscript “pg” means “photographic.”) The g-band magnitude in the SDSS is similar to what was used for these early results.
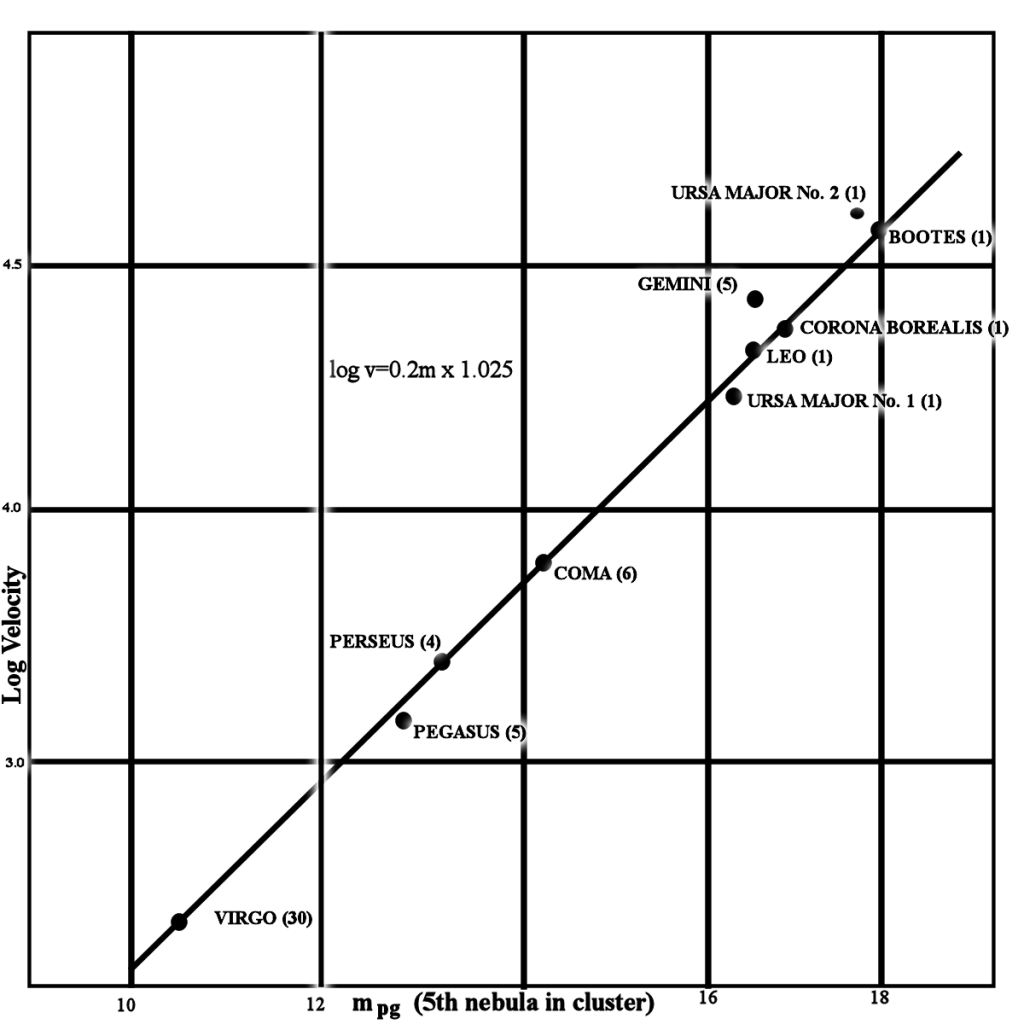
As the x-axis of the figure shows, the value for mpg is for the 5th-ranked galaxy (“nebula”) in the respective cluster. Their recipe: after discounting any galaxy that may not be a member of the cluster (because it appears to be in the foreground or background), rank all the galaxies in decreasing order of brightness. Finally, choose the 5th ranked galaxy and record its apparent brightness as magnitude. The ranking that is chosen for this method is not significant as long as you are consistent. Hubble found that choosing a galaxy from the middle of the pack yielded better results.
The choice of the 5th ranked galaxy is a little arbitrary, so we might expect the relationship between the redshift and the magnitude of these galaxies to have a large scatter. This is what Hubble found, and it is also why he needed to measure galaxies over the largest possible range in distances in order to see the relationship clearly.
Construct Your Own Hubble Diagram
 Returning to the Abell Galaxy Clusters, we now attempt to duplicate the graph Hubble constructed using our own data. Although there are many ways to obtain the data you need, we recommend using the Search Form tool to construct a special set of commands called an SQL (Structured Query Language) query. Using this tool, you can write instructions to the SDSS database that return specific information. Do the following:
- Go to the Navigate display for each galaxy cluster.
- Select Label and Grid from the drawing options box.
- Using the dimensions of the Navigate window as a guide, determine the approximate diameter of each cluster in arc minutes.
- Use the EZSearch tool to construct a query that returns all member galaxies within 0.05 of the average redshift previously calculated for that cluster.
- Modify the query so it returns results ordered by the g magnitude.
- Record the redshift and g magnitude for the fifth brightest galaxy in each cluster.
Once you have gathered all your data, create a column to record the calculated velocity of each galaxy from its redshift. Remember, the velocity is derived by multiplying the measured redshift (z) by the speed of light (c). Equation: (v = c z). In a separate column, report the log of the velocity.
Using whatever method is most convenient for you, graph the log of the velocity of the galaxy versus magnitude.