Now we can start making the connection between the peaks and valleys we see in a star’s spectrum and the energy levels of the star’s atoms.
Let’s say that I shine a light with all the colors of the spectrum through a cloud of hydrogen gas. Not all of the light will make it through. All the photons that have exactly 10.2 eV of energy will not make it through the hydrogen, because they will be absorbed by hydrogen atoms jumping from the first energy level to the second energy level. Likewise, no light with an energy of 1.89 eV will make it through; those photons will be absorbed by hydrogen atoms jumping from the second energy level to the third energy level. The light that the hydrogen cloud absorbs shows up as dips in the cloud’s spectrum.
If the cloud were too hot, however, all its hydrogen atoms will crash into each other with enough force to free their electrons, and the gas will become ionized. The hot cloud’s hydrogen ions have no electrons, so they cannot absorb light. When you look at the hot cloud’s spectrum, you will not see any valleys from hydrogen absorption lines. Ionization occurs at about 10,000 K for hydrogen. Therefore, if you do not see hydrogen lines in the hot cloud’s spectrum, you can conclude it is hotter than 10,000 K.
However, if the cloud were too cool, then the light would not have enough energy to boost its electrons into higher energy levels. In this case, you also would not see any hydrogen lines in the cloud’s spectrum. You would see the strongest hydrogen lines for a cloud that is at about 9000 K.
If you saw a cloud whose spectrum showed no hydrogen lines, how would you tell if it were hot or cool? For a cloud of pure hydrogen, you couldn’t. But for real stars, which contain atoms of many elements besides hydrogen, you could look at the absorption and emission lines of other elements.
Absorption and Emission Lines in Real Stars
For most elements, there is a certain temperature at which their emission and absorption lines are strongest. The lines you see in a star’s spectrum act like thermometers. Some compounds, like titanium oxide, only appear in the spectra of very cool stars. Others, like helium, appear only in the spectra of very hot stars.
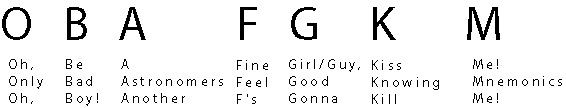
Therefore, the sequence of spectral types, OBAFGKM, is actually a temperature sequence with O representing the hottest stars and M representing the coolest stars.
Here are some useful devices to remember the order of the spectral types:
The table below shows some of the characteristic absorption and emission lines of each star.
| Spectral Type | Temperature (Kelvin) | Spectral Lines |
| O | 28,000 – 50,000 | Ionized helium |
| B | 10,000 – 28,000 | Helium, some hydrogen |
| A | 7500 – 10,000 | Strong hydrogen, some ionized metals |
| F | 6000 – 7500 | Hydrogen, ionized calcium (labeled H and K on spectra) and iron |
| G | 5000 – 6000 | Neutral and ionized metals, especially calcium; strong G band |
| K | 3500 – 5000 | Neutral metals, sodium |
| M | 2500 – 3500 | Strong titanium oxide, very strong sodium |
You may not know where all of these elements have their emission lines. The chart below lists some of the more common ones and their approximate location in the electromagnetic spectrum.
| Spectral Lines | Wavelengths (Ångstroms) |
| Hα, Hβ, Hγ | 6600, 4800, 4350 |
| Ionized Calcium H and K Lines | 3800 – 4000 |
| Titanium Oxide | lots of lines from 4900 – 5200, 5400 – 5700, 6200 – 6300, 6700 – 6900 |
| G Band | 4250 |
| Sodium | 5800 |
| Helium (neutral) | 4200 |
| Helium (ionized) | 4400 |
If you are interested in learning where to find all the lines the SDSS software uses, you can find a table of all the lines.
Question 4. How does your classification system compare to the OBAFGKM spectral type classification shown above? What are the similarities? What are the differences?
Now, take a look at the spectrum you saw earlier:
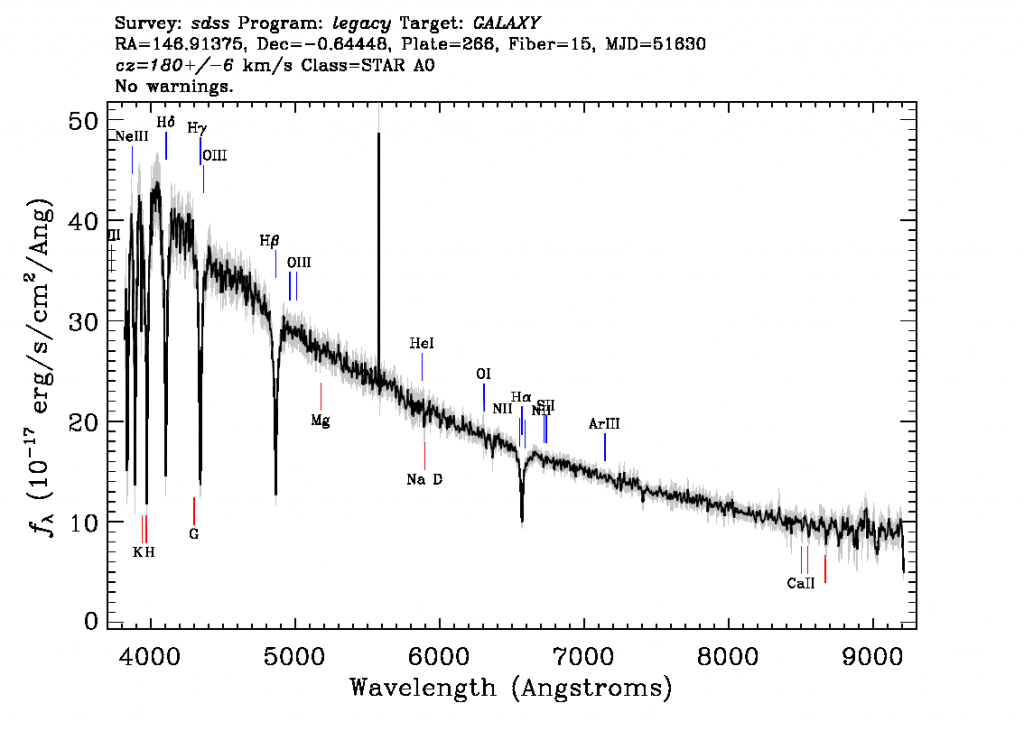
Question 5. What lines are present in this spectrum? Do you see any spectral lines of ionized atoms?
Question 6. What is the spectral type of this star?
Got your answer? Click Next to see how you did!