SDSS used thousands of aluminum plates, just like the one your class has, to measure the spectrum of objects in the sky. Each hole on the plate represents the position of an object on the sky. SDSS astronomers measured the spectrum of many millions of objects: some are stars, some are galaxies and some are quasars.
Your plate has around 1000 holes in it (yes, really!), each corresponding to an object in the sky. Although all of these objects are bright enough to be seen using the SDSS telescope, you wouldn’t be able to see these with your naked eye – the constellations you are about to make were not within the reach of ancient cultures.
Step 1 – finding the brightest objects on your plate
In the same way that our ancestors chose the brightest objects in the sky to make pictures, we will choose the brightest objects in your plate. SDSS astronomers measured the magnitude of all objects in your plate, and have stored all of those numbers in a large set of tables, called a database. You will use a simple computer language called SQL to ask the database a question: which objects on my plate are the 20 brightest?
The following text does exactly that:
select top 20 spa.ra, spa.dec, spa.dered_r as magnitude, spa.class, spa.z, soa.xfocal as x, soa.yfocal as yfrom specphotoAll as spa join specObjAll as soa on soa.specObjID = spa.specObjID where spa.plate = XXXX and spa.dered_r > 0 order by spa.dered_r asc
Get ready to find the brightest objects on your plate, using the SQL Search tool below.
- Click the Unlock button so you can enter your query into the search window
- Copy the text above and paste it into the “SQL Search” window below
- Replace the XXXX with your plate number (for example, if you have plate number 7616, enter 7616)
- Click Submit
- The 20 brightest objects on your plate will appear under Results to the right of the query window
- Click Download to save the results to your computer as a CSV (comma-separated value) file
Search
Results will appear here
Step 2 – Drawing your constellation
Next, we will use a spreadsheet to plot the positions of the 20 brightest objects of your plate. The example used here is done in Google Sheets, which requires a free Goggle Account, but you can use MS Excel, or any other spreadsheet software available to you.
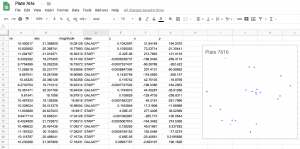
Create a new Sheet, and import the .csv file that you downloaded from in step 1 above using File -> Import. You should see your data neatly arranged in a table. Select the last two columns (X and Y) and create a “Scatter Plot”. X and Y are the coordinates of the positions of each object on the plate, with the origin being located at the centre of the plate. You should get a plot like the one shown below.

Print the scatter graph you have created. Now, in groups or individually, imagine the points in your graph are stars on the sky, and imagine what they might represent. Draw your constellation, and write a short paragraph about what it means.
Step 3 – Showing your constellation on your plate
Finally, you will light up the stars of your constellation in your plate. The X and Y positions that you used are given in millimetres, and the centre of the plate corresponds to X=0 and Y=0. With the tab of the plate pointing up, X increases to the right and Y increases down the way (moving away from the tab). Using rulers and guidelines, find the holes that correspond to the 20 holes that you used for your constellation.
Instructions to help you find the holes on your plate that correspond to a given object can be found here : Locating objects on your plate.
How you light up your constellation is up to you! You can use Christmas lights, or bright reflecting stickers, or anything else! Use different colours for the different types of objects, as given by the “CLASS” column.
Display your plate to the rest of your school, together with all the drawings that different groups or people in your class designed based on the lit-up pattern on your plate. Your display should explain to others what the plate is, what constellations are, and what the different classes of objects are. Send us a photograph of your display!
Step 4 – Extra challenge
In the same way that the stars of Orion are not all at the same distance from Earth, the objects in your plate are all at different distance. The column Z in your table is redshift, which astronomers can use to calculate the distance of an object to us. Typically you will find that objects with CLASS = star will have a redshift that is very close to zero, and sometimes negative. The brightest galaxies in your plate will typically have a redshift between 0.01 and 0.15, and bright quasars will have redshifts between 0.1 and 2.
The tables below tell you the distances that correspond to various values of redshift, in units of millions of light-years and in units of Megaparsec. One Megaparsec is the same as 3262000 light years. By looking for the closest values of redshift in the tables to the redshift of each of your objects, you can make a list of the distances to your objects.
Can you make a three-dimensional map of your constellation? Ideas for how to create a 3D map of the objects on your plate can be found here: Creating a 3D Display but there are lots of possible creative ways to display this data!
Redshift-distances table for objects with Z less than 0.2
Redshift-distances table for objects with Z greater than 0.2
