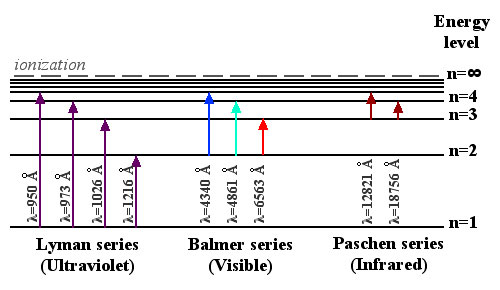
Even though hydrogen has only one electron, the electron can jump between many different energy levels. The table below shows the wavelength of light that will be emitted or absorbed for a transition between one energy level and another. Read the table by reading down from one level at the top and to the right from one level at the left. For example, a transition between n=2 and n=1 requires that a photon of wavelength 1216 Ångstroms be emitted or absorbed.
| n=1 | n=2 | n=3 | n=4 | n=5 | |
|---|---|---|---|---|---|
| n=1 | – | 1216 Å | 1026 Å | 973 Å | 950 Å |
| n=2 | – | – | 6563 Å | 4861 Å | 4340 Å |
| n=3 | – | – | – | 18,756 Å | 12,821 Å |
The graph below is another way of presenting the information in the table. The label on the y-axis shows the energy level. The arrows show the jumps in energy level for possible electron transitions.

The transition that is most useful to astronomers is the one in the middle, with electrons jumping up from n=2 or down into n=2. These transitions are called the Balmer series, after the physicist who first studied them. The reason that they are so useful is that the wavelengths emitted or absorbed are wavelengths of visible light.
How does this apply to spectra? Remember the spectra you classified in the last activity. If you look at one of the spectra again, you should notice an obvious valley at about 6500 Ångstroms – the wavelength of the first transition in the Balmer series (n=3 to n=2). Astronomers call this the Hα (Hydrogen-alpha) transition, and they call its signature in a star’s spectrum the Hα line.
Question 5. The spectrum below is the spectrum of a typical star. Click the link to see the star’s Quick Look entry. Below the spectrum is a zoomed-in view of the area around 6560 Ångstroms.

The spectrum of a typical star. Click on the spectrum to see a larger version.
You saw in the table and graph above that the Hα transition is at 6563 Ångstroms. So, the zoomed-in view shows the Hα line for the spectrum. Does this star whose spectrum is shown here have more light at the Hα wavelength, or less light? How do you know?
Question 6. Given your answer to Question 5, is the Hα line in this spectrum an emission line or an absorption line? How do you know?
An Hα absorption line is produced when hydrogen absorbs light, so there must be hydrogen in the star. When you see an absorption line, what is actually happening is that the hydrogen in the outer layer of the star is absorbing energy coming from deeper in the star.
But the discovery you have made is amazing – you have connected what you observe in a distant star to what you observe about atoms studied here on Earth. You have identified an element in a star, and it is the same as an element known from here on Earth.
Question 7. Look again at the spectrum from Question 4. Can you find the lines labeled Hβ, Hγ, and Hδ? What transitions do you think these lines correspond to?
