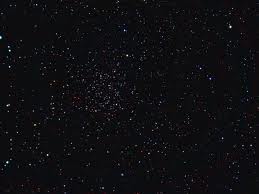
Imagine the sky in your area on a clear night – or just look at the picture on the right. What colors do you see? If you are like most people, you see very little variation in the color of stars. It takes very dark skies, patience, and careful observation to detect the subtle color differences between stars.
It can be difficult to imagine how differences that appear so small can be so important to understanding stars and collections of stars – galaxies and clusters. Because light is the only thing that comes to us from stars, color is enormously important in astronomy. With improvements in telescope design and the invention of technologies like filters, we are able to use color as a tool for understanding size, life cycles, and distances to stars in our Milky Way. Let’s start by looking at stars through the SDSS telescope.
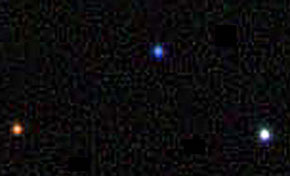
The picture on the left was captured by the SDSS telescope and camera. Its magnification is hundreds of times greater than your unaided eye can see. The color differences in this image are obvious because the SDSS telescope has a 2.5 meter surface that captures light which is then gathered and stored for 54 seconds before being recorded. In contrast, your eye sends picture signals to your brain at the much faster rate of once every 77 milliseconds. For astronomy purposes, however, slower is better. The SDSS telescope is best for seeing detail in the sky (whereas a picture every 54 seconds wouldn’t do you much good when trying to cross the street).
The SDSS uses the light it captures to make the beautiful images you see in SkyServer and record measurements that are used to calculate brightness and color. In this activity, we explore these measurements and learn how to interpret them. Begin by choosing a unique place in SkyServer from which to gather data.
Find a Starting Place
![]() Space is vast and infinite, and with 500 million stars in the SDSS database, there are enough stars to go around for all researchers. Everyone should be able to start in a unique location, or Special Place (as you proceed in your experimentation and data collection, you will be able to build upon your knowledge base for your Special Place since you will continue to revisit it in other activities). If you completed the activity, My Special Place in the Database (need to add link), you already have a set of coordinates as your own Special Place. Use the RA and Dec that you recorded during that activity. If you do not yet have your own Special Place, you will use RA and Dec to define a starting place (which will then become your Special Place, your very own “little plot of space real estate” to explore evermore).
Space is vast and infinite, and with 500 million stars in the SDSS database, there are enough stars to go around for all researchers. Everyone should be able to start in a unique location, or Special Place (as you proceed in your experimentation and data collection, you will be able to build upon your knowledge base for your Special Place since you will continue to revisit it in other activities). If you completed the activity, My Special Place in the Database (need to add link), you already have a set of coordinates as your own Special Place. Use the RA and Dec that you recorded during that activity. If you do not yet have your own Special Place, you will use RA and Dec to define a starting place (which will then become your Special Place, your very own “little plot of space real estate” to explore evermore).
Enter Your Starting Coordinates into the Navigate Tool
- Go to the SkyServer Navigate tool
- Enter the RA and Dec coordinates into the appropriate spaces in the parameters box.
- If the new location does not automatically reload, click the Get Image button.
- This is your starting place for observing star colors.
Collect Stars of Different Colors and Brightnesses
![]() From your starting place in Navigate, zoom in until you are able to see individual stars clearly but still have approximately 20 – 30 in the image window.
From your starting place in Navigate, zoom in until you are able to see individual stars clearly but still have approximately 20 – 30 in the image window.
- From the Navigate image window, select approximately 20 stars of different colors and apparent brightnesses.
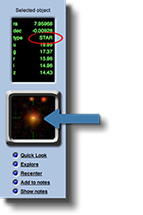
- Add each star to your notes by selecting the Add to Notes radio button.
- View your list by clicking the Show Notes radio button
Look for Patterns
 The SkyServer NoteBook allows you to look at and compare brightness information for each of the stars you selected. You should have noticed that each filter has a number associated with it. This value is calculated from the amount of light recorded by the SDSS camera in comparison with the bright star Vega. It is called magnitude. Let’s first discover a few things about what these numbers tell us.
- Click Show Notes to open your NoteBook.
- Open your collection in Images List by clicking Upload to Image List Thumbnail images of each star will be displayed the order they appear in your NoteBook.
- Drag the tabs to a position where you can see the NoteBook and Image List tool at the same time.
- Using the r column, scan the magnitude measurements, comparing them to the thumbnail images. Do you see a pattern? What can you conclude about magnitude measurements from your observations?
- Observe the magnitude measurements across the different filters. What do you notice?
Color
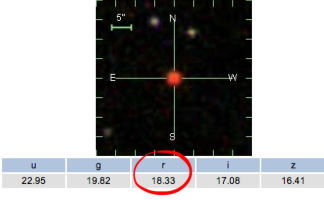
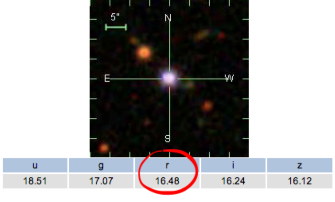
We can see from our observations that only knowing how bright a star appears through a particular filter is not enough to compare the color of two stars. Consider the two stars below. These stars are obviously different colors. If you examine the magnitude of the two stars in the red filter, you find that the blue star is brighter in the red filter than the star that appears red! Examine the reported magnitudes in the remaining filters. What do you notice? ![]()
