In this activity we will cover some of the spectral properties of elliptical and spiral galaxies only by looking at their spectra.
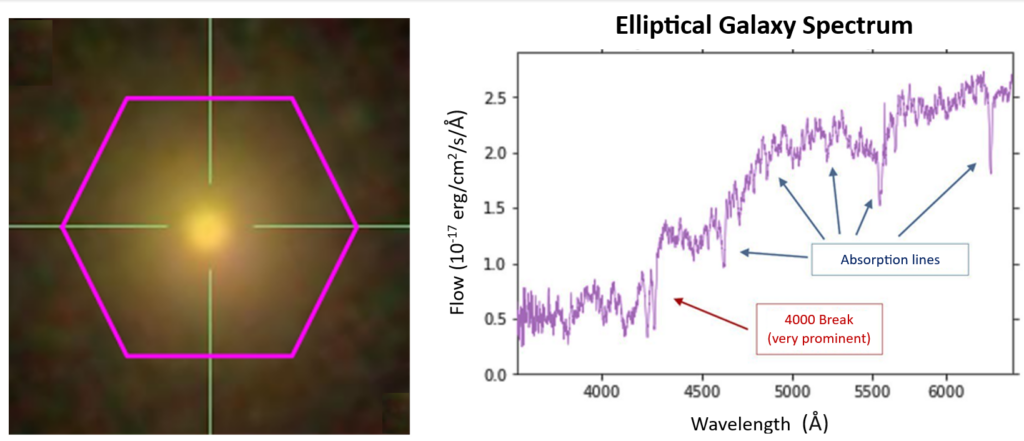
In the spectra of elliptical galaxies, we usually find the presence of absorption lines, which look like valleys that descend in the plot (Figure 5). Most of the radiation of this type of galaxies comes from their stars. The absorption lines are caused by atoms of several elements, which absorb photons in the stellar atmospheres. This phenomenon mostly occurs for old stars (big, cold and red), which are usually the most common in this type of galaxies.
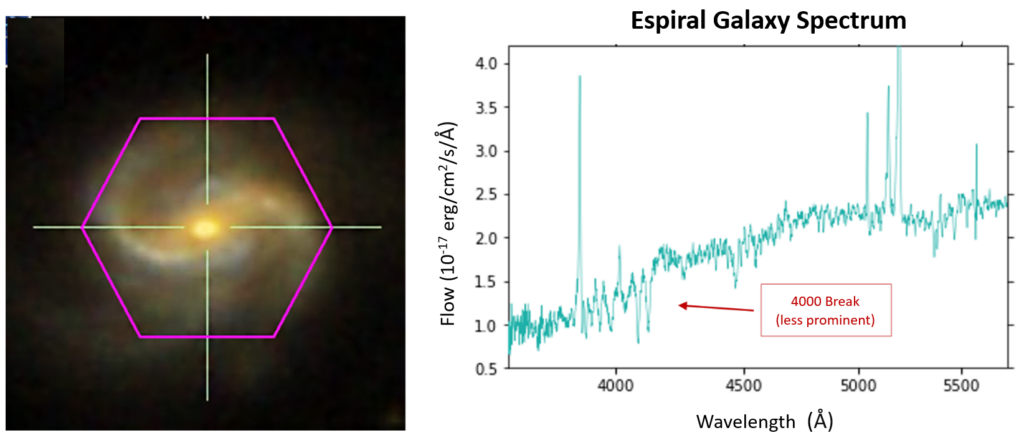
On the other hand, the spectra of the spiral galaxies are more prone to show emission lines (if coming from the star formation activity), which can be seen as peaks that ascend in the plot and can be linked to the specific element that is emitting the photons (Figure 6). These lines are generally produced by heated gas (ionized) surrounding young stars (small, hot and blue), which tend to be common in this type of galaxies.
The principal absorption lines are: Ca, Mg y Na, while the most prominent emission lines are: [OII], Hδ,Hγ, Hβ, [OIII], Hα y S2 (Hδ, Hγ, Hβ and Hα can also be in absorption).
In order to understand a bit better the spectral lines of the galaxies we can try to analyze the behavior of the stars in and independent way. Just as the galaxies, each star has its own spectrum which can show both, absorption and emission lines. Usually the former ones are visible in the oldest stars, while the later ones can be found in the younger stars. Now, we know that the galaxies are formed by stars among other components, so when we take a look at the spectrum of a galaxy we are actually observing at the combination of the spectral lines coming from all its constituents.
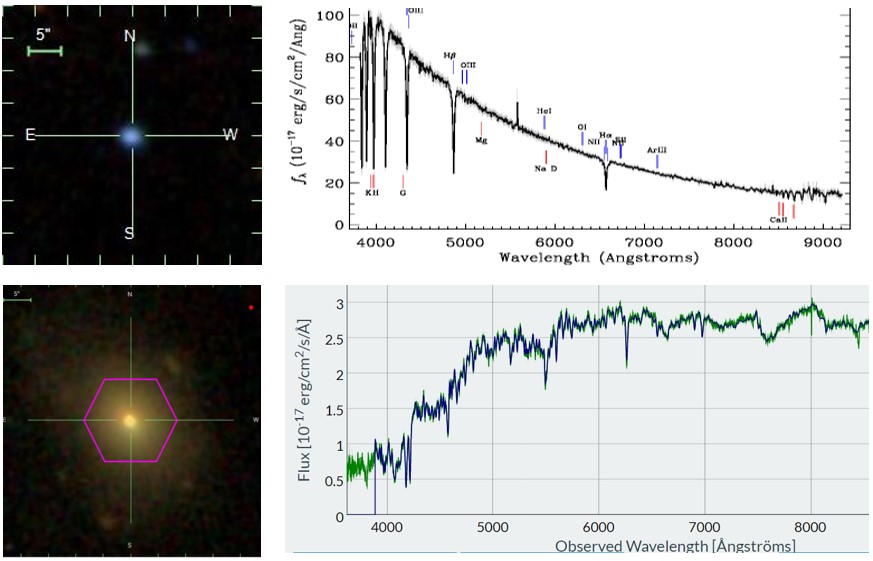
Let’s see an example in Figure 7, in which there are two spectra displayed. The first one belongs to a star which features a notable amount of absorption lines, while the second one belongs to an elliptical galaxy. This is a very illustrative example in which we can see how the absorption lines of the stars can visibly contribute to the spectrum of a galaxy (which also features these descending peaks), but remember that in the case of the spectrum of a galaxy, we are not only seeing the contribution of a single star, but of an entire population of stars along with the contribution of the rest of its constituents.
Another very important aspect while analyzing the spectra of galaxies is a characteristic known as “4000 Break”. Commonly the spectra of the galaxies have a relatively flat and continuous shape. However, we can see a characteristic in them, and that is a drop of the spectrum, which we can notice in the spectra plots around the 4000 Angstroms (in thse wavelength axis). This drop is caused by the absorption of the radiation from the metals in the stellar atmospheres, and by the shortage of young stars. As we saw before, the elliptical galaxies have mostly older stars, just as the opposite of the spiral galaxies which tend to have mostly younger stars. All of this means that the 4000 Break will be more evident in the former (e.g. Figure 5) than in the later ones (e.g. Figure 6).
Lastly, the fact that some spectral lines are too wide may be due to something called nuclear activity (not associated to the stars). This activity can occur in both, elliptical and spiral galaxies, however the effect of the nuclear activity in the spectra of galaxies is out of the scope of this exercise, so we are not going any further about this.