A galaxy is a system made up of stars, planets, interstellar dust, black holes, and dark matter. This system is held together by the gravity of its elements.
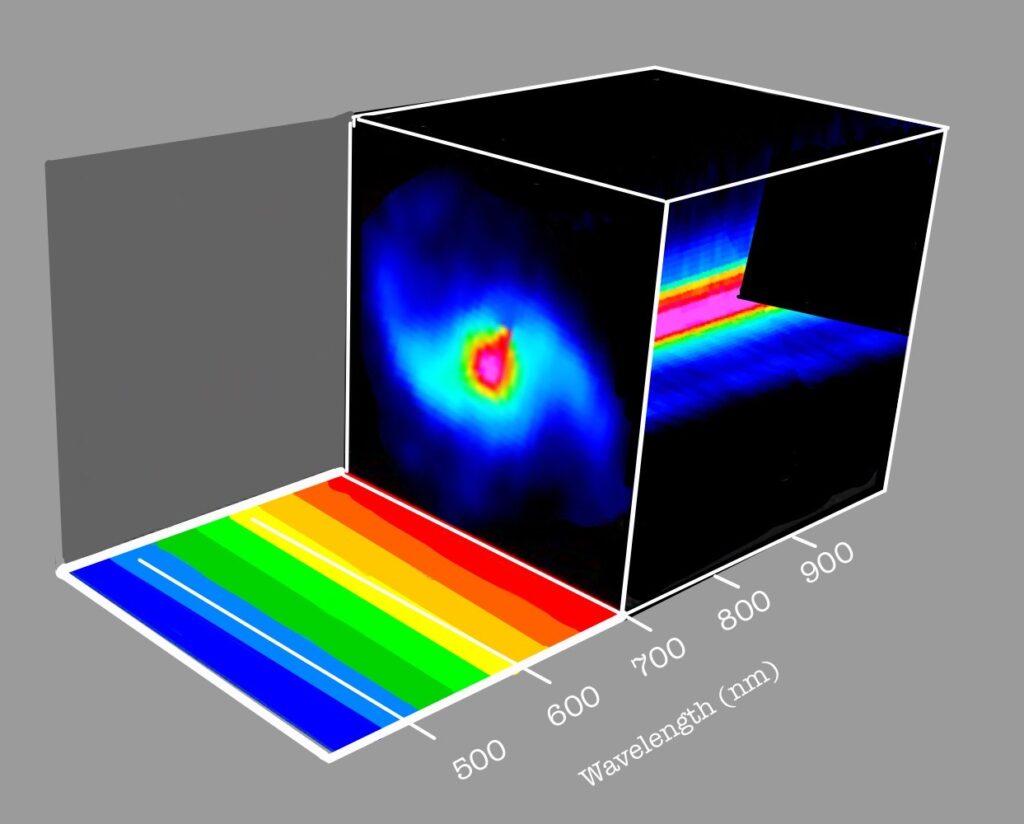
A famous astronomer named Edwin Hubble, who was a tireless explorer of the sky, discovered the nature of galaxies a century ago and he began to classify them, according to their shape. Later, there were more astronomers who, inspired by his work, undertook the task of perfecting his arrangement. This is how the well-known “Hubble Diagram” [Image 1] has remained the basic and most practical galaxy classification system to use.
In the diagram we have, mainly, three types of galaxies: Elliptical, Lenticular and Spiral.
But why is it so important to classify galaxies? Classification is a widely used practice in science, since it helps us identify the common characteristics that various elements have, such as their composition, shape, size, etc., this greatly facilitates their analysis. An example we have seen, since we were little, is the classification of animals. One way to group animals is into amphibians, fishes, mammals, reptiles, birds, etc. This classification helps us to identify and study their characteristics by groups. The same goes for galaxies! It is necessary to know their general characteristics in different groups, because there are so many, imagine if you wanted to study each one in detail!
Knowing the morphology, that is, the classification according to the shape and evolution of galaxies, it is important to study their properties. For this, a very important observation technique in astronomy is spectroscopy, which is based on analyzing how each object interacts with light, that is, if it absorbs, reflects, emits, or refracts the light. An easy way to see it is thinking of the spectra as fingerprints; each person is born with a different fingerprint and this makes us stand out from the rest of the people, the same happens with every object that emits light. Each of these objects is associated with a unique spectrum, which can provide us with a large amount of information, such as the movement, age, or chemical composition of the galaxies.
In conventional spectroscopy, a spectrum of the observed object is obtained along a slice (using a slit) or a spot (using a single fiber). However, when we are looking to study extended objects such as galaxies, it is necessary to expand the field of view of the spectrum, this can be achieved with integral field spectroscopy.
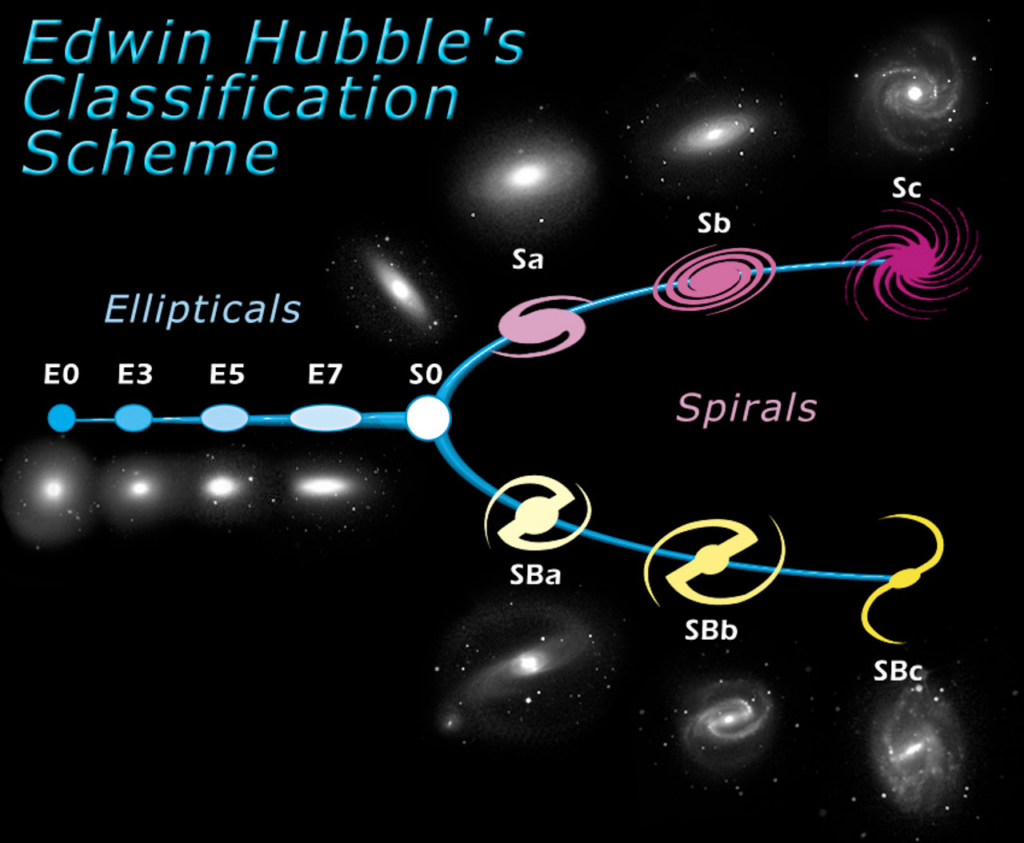
This technique provides information about a region of the sky, from instruments called Integral Field Units (IFU). There are different types of IFU, but we want to focus on those that use a collection of fibers, such as the electrical installations in houses. This kind of instrument is the one used by the MaNGA project (one of the projects of the fourth phase of the Sloan Digital Sky Survey collaboration, whose objective is to generate maps with detailed composition and kinematic structure, that is, the movement, out of 10,000 nearby galaxies). The fibers work as information packages [Image 2], since each individual fiber produces a spectrum at a different point of the observed object. Thus, a complete view of a galaxy can be obtained by using the IFUs to divide the field of view into segments.
To understand IFUs better, we can compare them to the eyes of a fly or some other insect [Image 3], which are made up of many tiny photoreceptors, these being like the bundles of fibers mentioned above! It’s like having thousands of eyes! The more photoreceptors there are, the larger and more detailed mosaic field of view the fly will have.

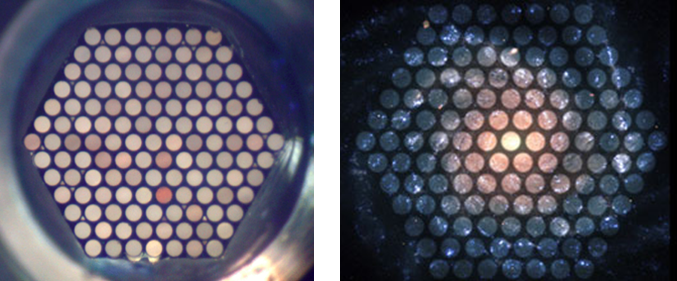
Subsequently, from the signal detected by each bundle of fibers, passing through a spectrograph, all the spectra of each point in the sky are obtained. All this information is concentrated in a file called “Data Cube” [Image 4], which allows us to store and analyse spatial and temporal data, that is, we can study the changes that our galaxy undergoes over time and not only those that we observe at the instant in which the readings are taken.