
Using Spectra to Measure Redshift
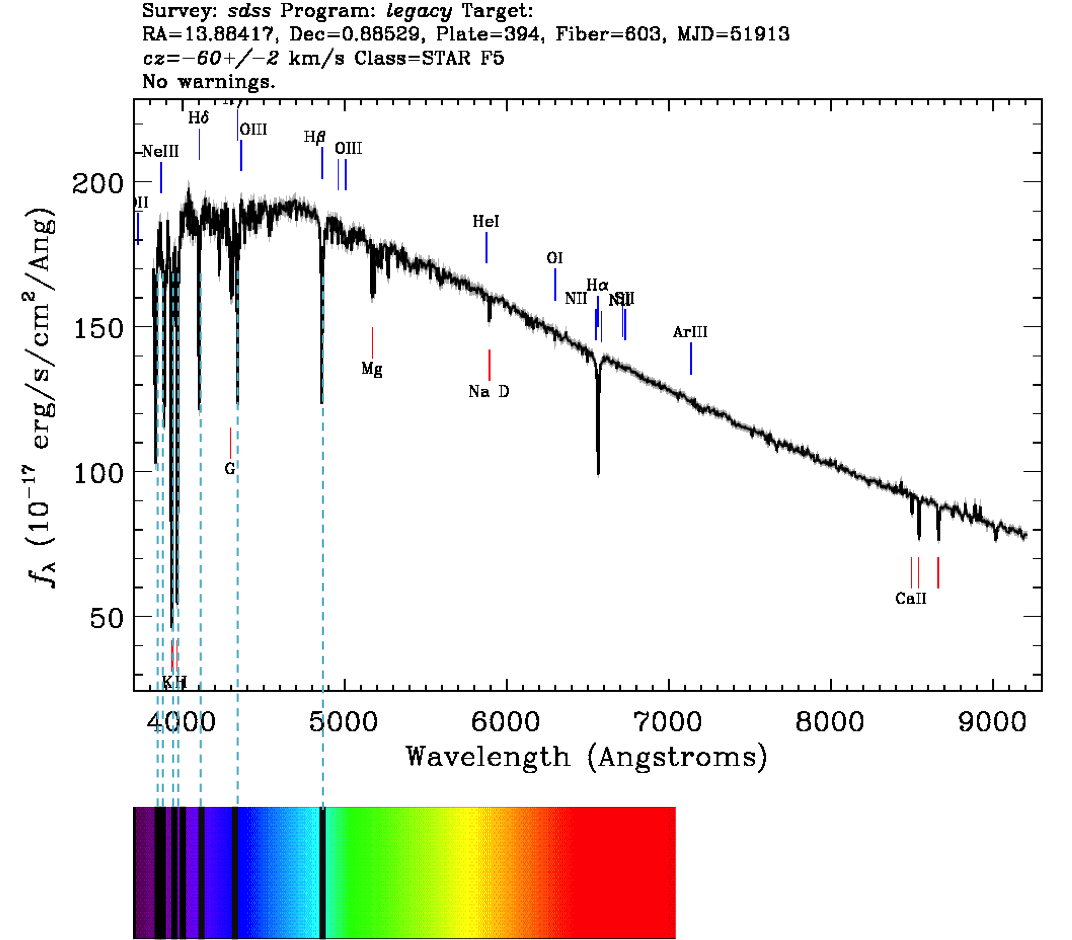
A spectrum (the plural of which is “spectra”) measures how much light an object gives off at different wavelengths. The spectrum of an astronomical object is often displayed as a graph, see Preflight – Spectra for more information about how to read a spectrum.
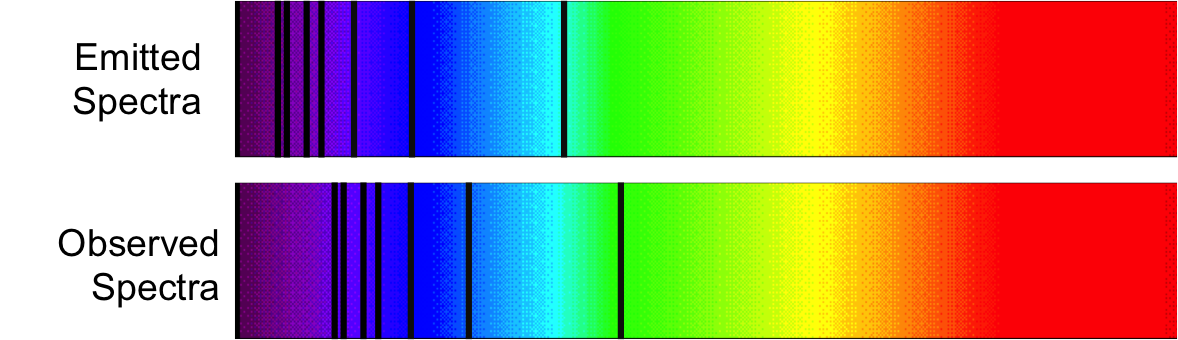
The spectra of stars and galaxies almost always show a series of peaks and dips called “spectral lines.” As discussed in Preflight – Spectra, these spectral lines tell us about the type and composition of the object we are observing. Astronomers know what spectral line positions and spacings to expect when looking at an astronomical object (such as a galaxy) because they know what type of object it is, and what the chemical composition is likely to be. However, when galaxies are observed, almost all of them have spectral lines at a longer (redder) wavelength than expected. This effect is called redshift.
Calculating Redshifts
Redshift (z) is defined as the difference between observed and emitted wavelength, divided by the emitted wavelength. TODO: Format with latex
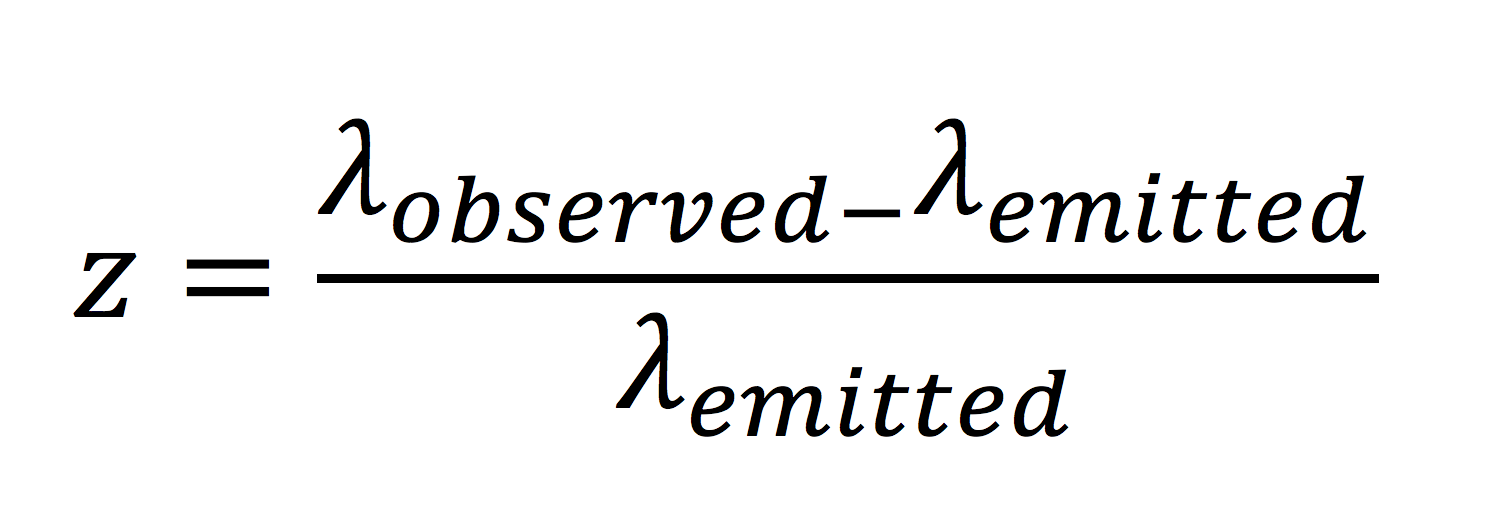
λ represents the wavelength. The emitted wavelength is the wavelength that would be measured if the galaxy was nearby and stationary, the observed wavelength is the wavelength that is measured when observing the galaxy.
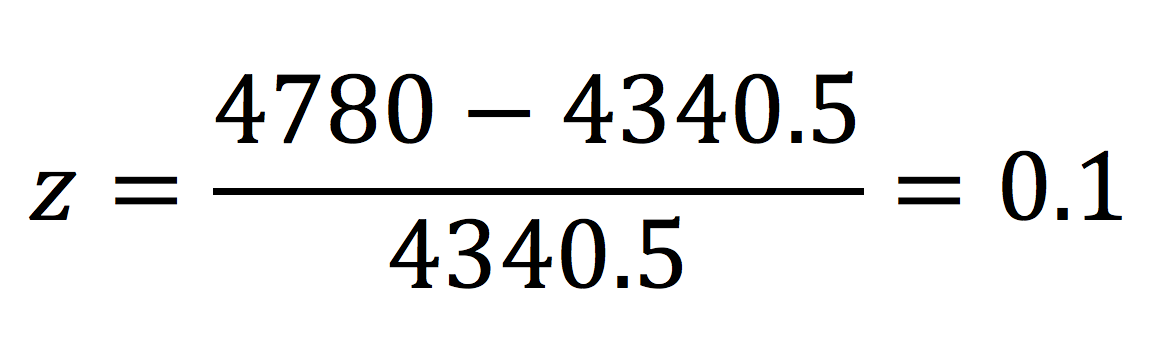
For example, the Balmer gamma line of Hydrogen emission is emitted at rest at a wavelength (λemitted) of 4340.5 Angstroms. If you identify this emission line in a galaxy spectrum, and find that it has been shifted to an observed wavelength (λobserved) of 4780 Angstroms, you can simply calculate the redshift:
What Causes Redshift?
There are two ways to think about redshift: Doppler shift and Cosmological Redshift. Both effects refer to the change in the wavelength of light that is emitted from an astronomical object, but you can think about them in two very different ways.
Doppler Shift
Doppler shift is the effect that you can hear when a fast car passes by you. As it moves towards you, the sound waves in front of the car are compressed (making the pitch higher), whereas when it moves away from you, the sound waves are stretched out, making the pitch lower.
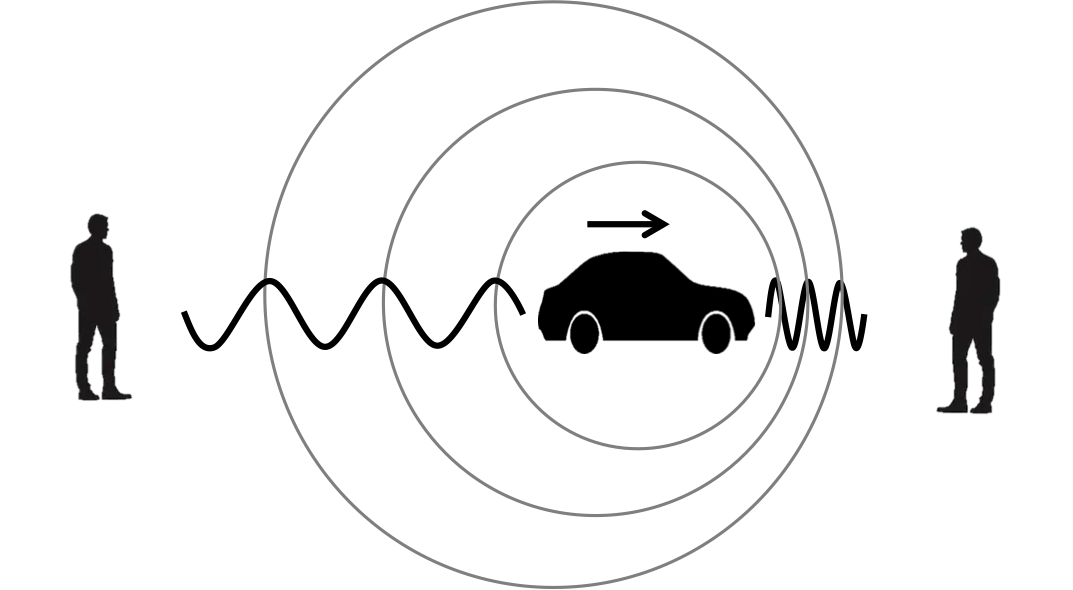
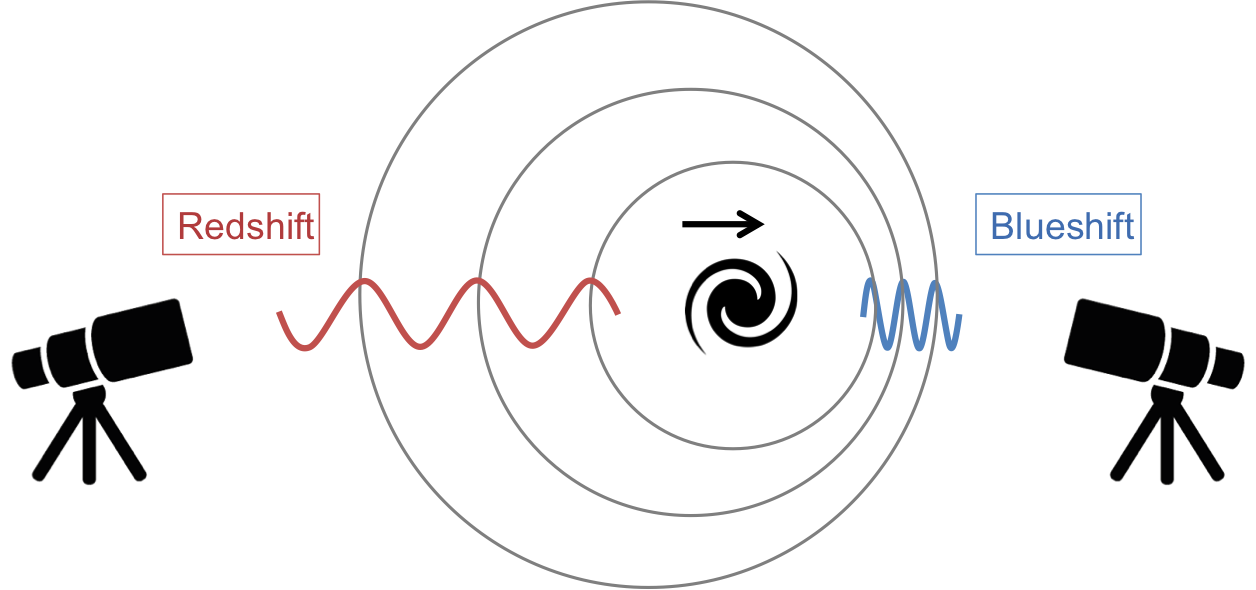
The same effect can be seen with light: if an object is moving towards you then the wavelengths will be compressed, shifting them towards the blue (shorter wavelengths). Similarly, if an object is moving away from you then the wavelengths will stretch out, shifting them towards the red (longer wavelengths). Everyday objects such as cars do not move fast enough for us to see a blue or red shift in their colour. But we can measure doppler shifts in astronomical objects.
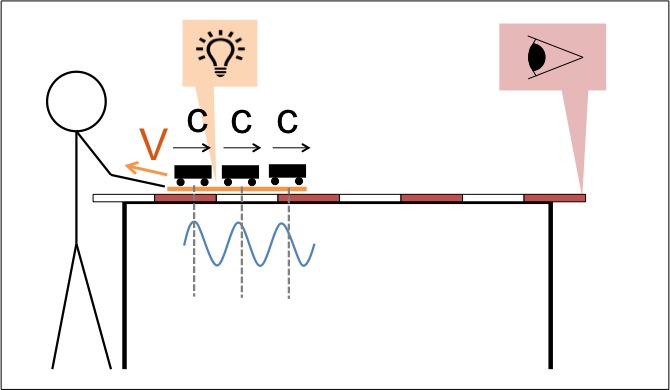
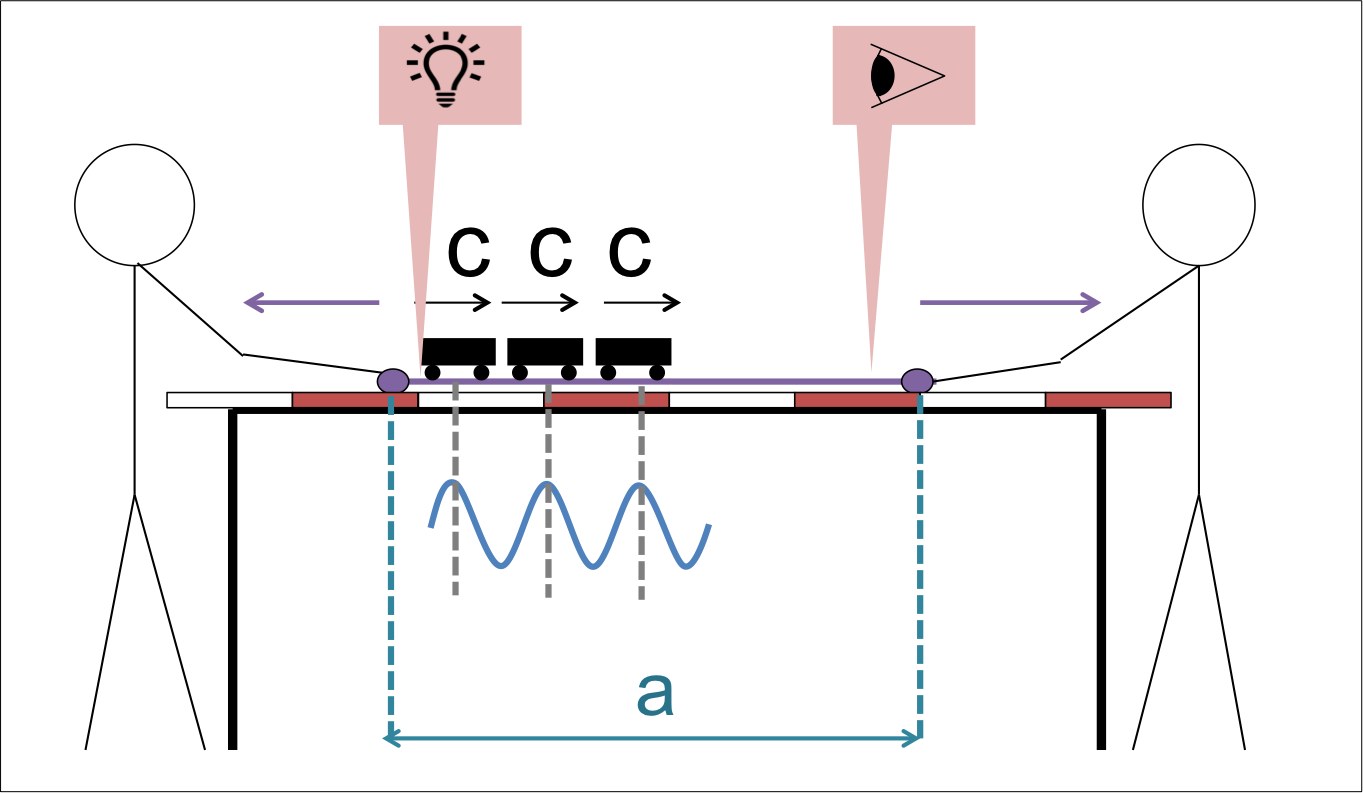
The lengthening of wavelengths due to Doppler shift can be explained in a practical demonstration by using LEGO vehicles to represent a wave of light, the set up for this demonstration is shown below.
Below is a video of this demonstration in action. It should be noted that the measurements given in the video are only approximations. This demonstration uses everyday objects such as LEGO so is not totally accurate.
The vehicles represent the peaks of a wave of light. The red board represents the source of the light (for example a galaxy). In this video, the observer would be to the left of the screen. The wavelength is small when being emitted from the source of the light. As the light is being emitted, the source of the light is receding from the observer (i.e., the board is moving to the right). This movement of the source of the light causes the wavelengths to increase.
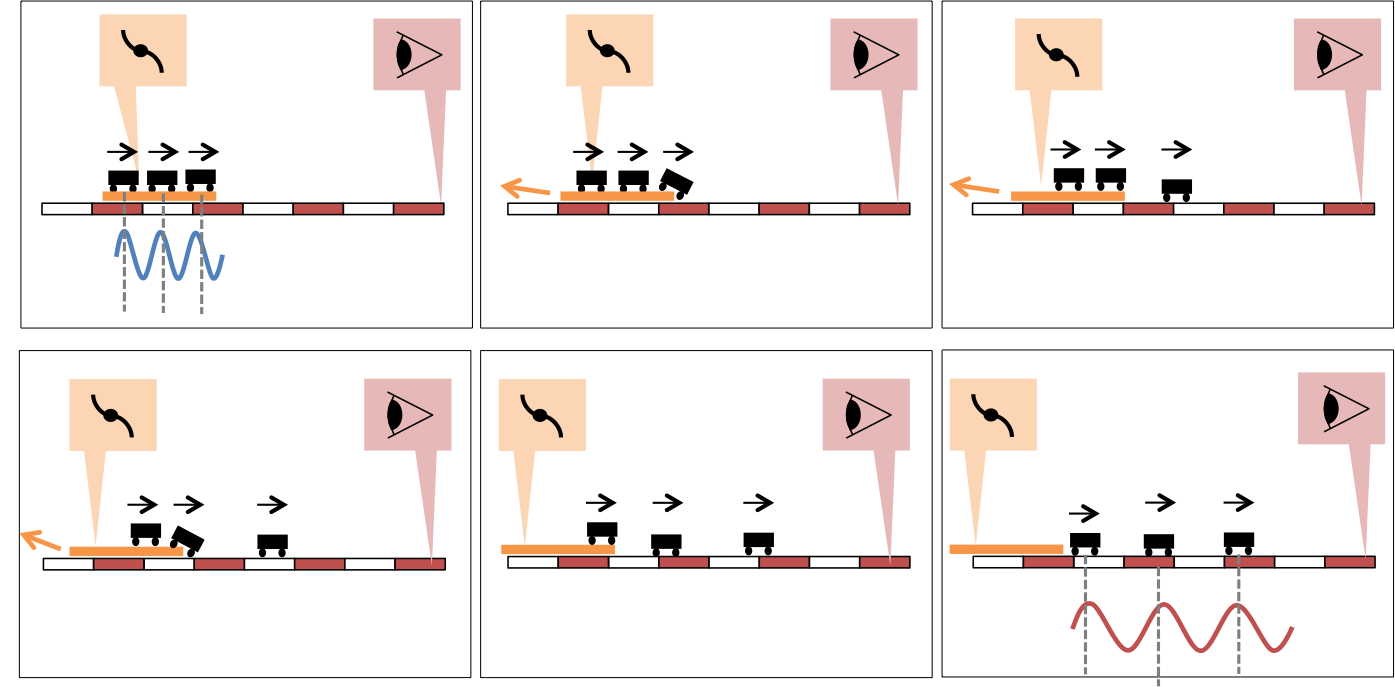
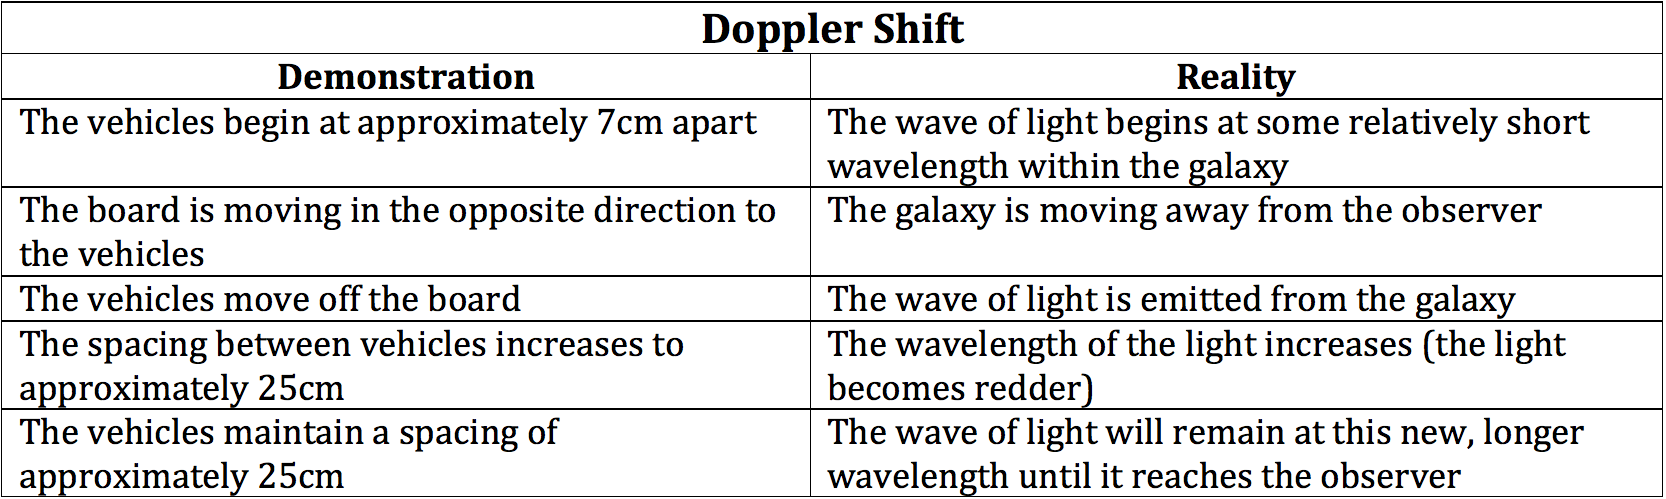
The table below gives a break down of each step in the demonstration and explains how each step of the physical analogy in the demonstration relates to reality. TODO: Format as HTML table
Uses for Doppler Shift
Doppler shift is measurable in astronomical objects when their velocity is large enough; this could either be a peculiar velocity, or a rotational velocity. Peculiar velocity measures the movement of a galaxy through the Universe, this may be caused by gravitational attraction between galaxies. The rotational velocity of a galaxy describes how fast a galaxy is rotating around its axis.
Doppler shift can be used to measure the rotational velocity of a galaxy. If one side of a galaxy is redder and the other is bluer, it means that the redder side is moving away from us, and the blue side is moving towards us therefore we know that the direction the galaxy is rotating in. MaNGA (Mapping Nearby Galaxies at APO) uses Doppler shift of galaxies to make velocity maps of galaxies, images of these can be found using Marvin.
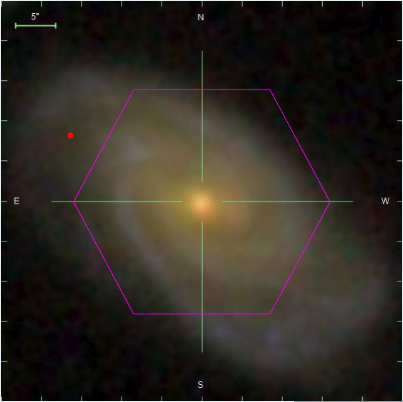
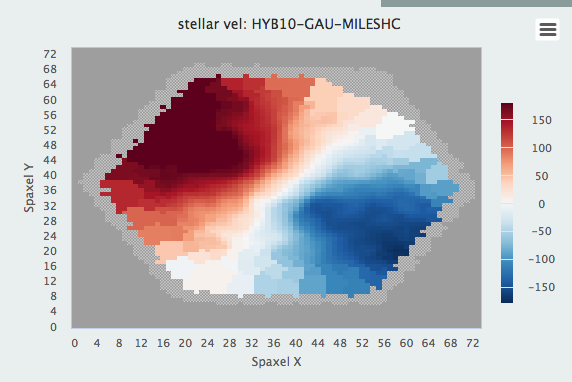
The images above are of a spiral galaxy (Manga ID 1-284485). The image on the left shows a photo of the galaxy, the image on the right shows the velocity map of the same galaxy. The blue areas are blueshifted, so are moving towards us. The red areas are redshifted, so are moving away from us.
Cosmological Redshift
The other effect that can cause wavelengths to be lengthened is cosmological redshift, this is an effect due to the expansion of the universe.
The Universe is expanding isotropically. This means that, on a large enough scale, everything in the universe is moving away from everything else. In 2D, it is analogous to an infinite rubber sheet being stretched equally on all directions, with the galaxies represented by coins glued onto this sheet. As the sheet expands, all of the coins will move away from each other. We don’t mean to say that galaxies are sitting on a real 3D expanding cosmic rubber slime, or that you should think of space as something that is stretchy. But the motions of the galaxies in such a Universe would be the same as the motions we see in our Universe.
The diagram below shows a section of the universe (the grey circle) containing 4 galaxies. The galaxy on the right is drawn as an eye, as it represents the Milky way (the galaxy we are observing from). From left to right, each panel is an arbitrary step forward in time.

Light from the galaxy on the left is traveling to the observer on the right. As the Universe expands, the wave of light lengthens as a consequence. This effect is called cosmological redshift because the wavelength of light shifts towards the red due to cosmological expansion.
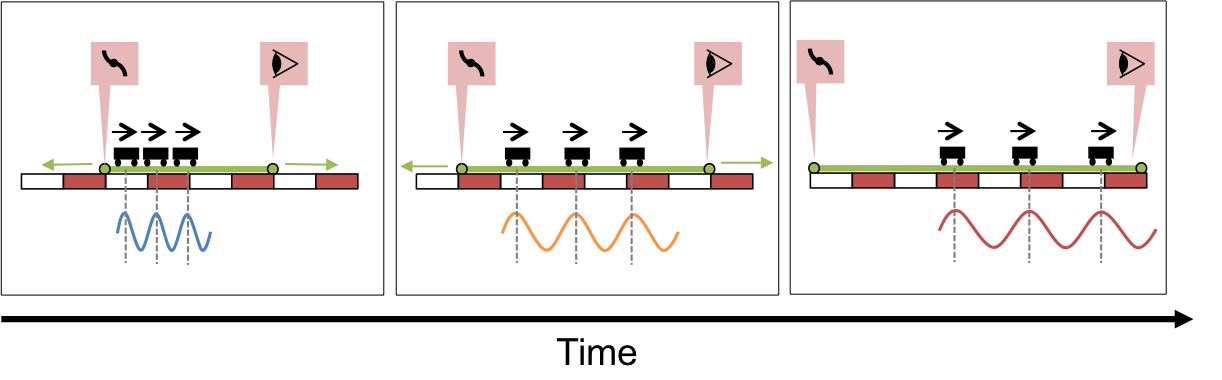
This effect is can be demonstrated in 1D using the same LEGO vehicles as before, but now placed upon a rubber sheet.
In this demonstration the rubber exercise band represents a section of the expanding universe. The 3D, isotropic expansion of the universe has been reduced to an expansion in one dimension in this analogy for simplicity. It should also be noted that in this demonstration you can see the ends of this band, where as in reality the Universe has no edge, no centre and is infinite in size.
It should be noted that the measurements given in the video are only approximations. This demonstration uses everyday objects such as LEGO so is not totally accurate.
The vehicles represent the peaks of a wave of light, the green band represents a 1D section of the Universe. The source of the light is on the right, the observer is on the left. As the vehicles travel along the band, the band is stretched from both ends, this is analogous to light traveling through the expanding Universe.
The section of the band labeled a(t) in this demonstration represents the relative size of the ‘Universe’ at any given time. Having these lines drawn onto the band help us to track how much the band has expanded by.
.
The table below gives a break down of each step in the demonstration and explains how each step of the physical analogy in the demonstration relates to reality. TODO: Format as HTML table – THIS IS THE WRONG TABLE (the right one has “Cosmological redshift” as the top header, as per “old” Voyages)
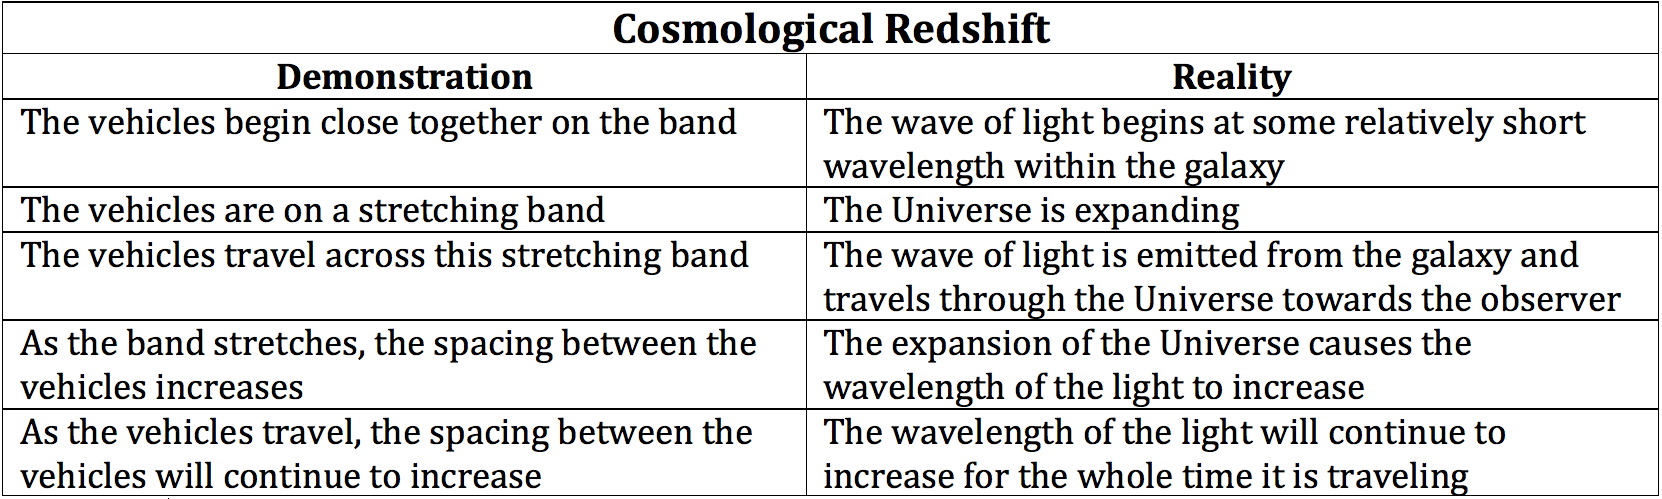
This demonstration is a useful way to think about how the expansion of the Universe effects the wavelength of light because it depends only on the relative size of the Universe at the time the light was emitted and the time when the light was observed. Therefore, in an expanding Universe (where the relative size increases with time), it is true that the larger the cosmological redshift, the longer the time period between light being emitted and being received, and therefore the further away the object is. Objects with a larger cosmological redshift are further away.
The cosmological redshift can be interpreted as a “recessional velocity”. Recessional velocity is the speed at which a galaxy is moving away from the Milky way due to cosmological expansion. This value is larger for further away galaxies, giving rise to the Hubble Diagram.