
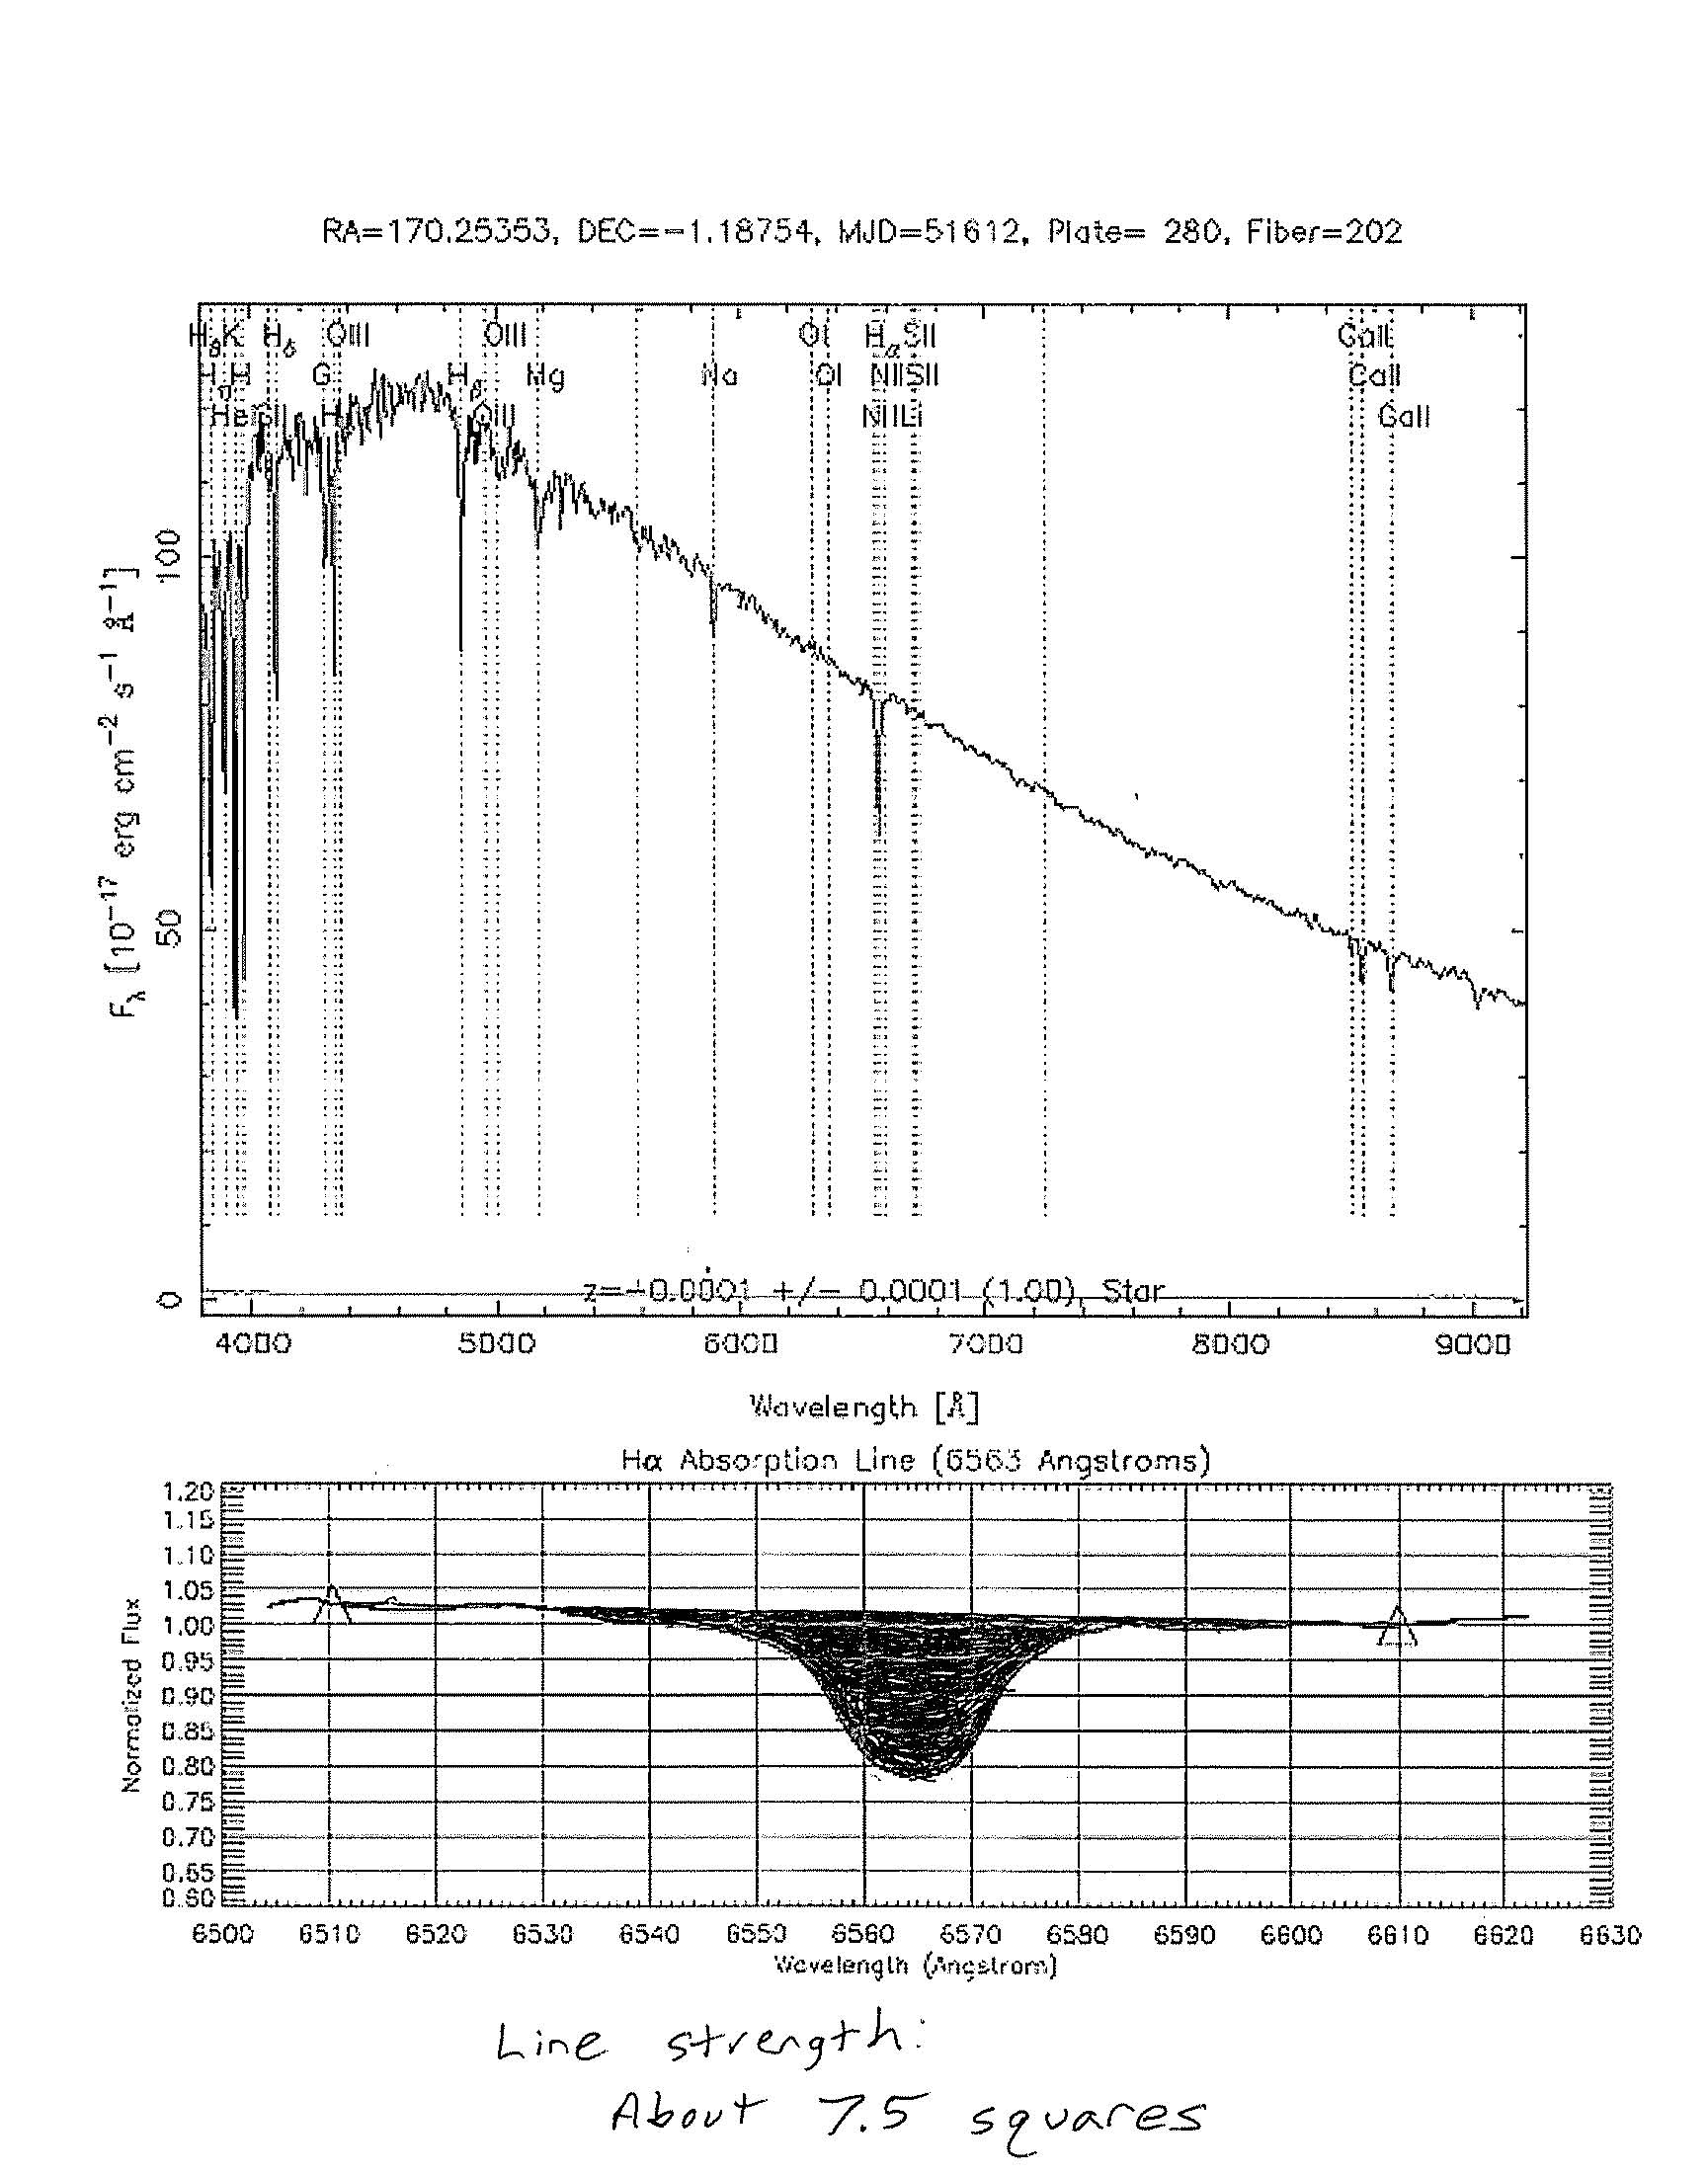
Now that you know what the lines mean and how to identify them, try classifying stars based on the “strength” of their hydrogen absorption lines, specifically the Hα line. The spectrum below is the same spectrum as in Question 5, again with a zoom-in of the spectrum’s Hα line shown below it.

Click on image to see a larger version
Notice that the Hα absorption line dips down vertically, but it is not a straight drop; the line has some width. The two triangles in the zoom-in mark two spots on the continuum spectrum. If you drew a line between the centers of the two triangles, you would see approximately how much light would have been emitted by the star if it had no hydrogen.
If you colored in the area between that line and the actual spectrum, you would see the amount of light “missing” from the spectrum due to hydrogen absorption. This amount is referred to as the strength of the absorption line.
The strength of an absorption line depends not only on the depth of the valley, but also on its width. You can get a rough measure of the strength of the Hα line by counting the number of grid squares you filled in when you colored in the area below the line connecting the triangles.
This example shows how the spectrum looks with the grid squares filled in.
Explore 2. Look at the spectra of these seven stars (the page will open in a new window). You can also view the seven stars in this PDF.
Using the spectra, rank the seven stars according to the strength of their Hα absorption lines.
If you can’t rank them all easily, try coloring in the area between the line connecting the triangle centers and the actual spectrum, then count the number of grid squares filled – just like you saw in the example above. The number of filled grid squares is a measure of the line strength.
Rank the stars by writing each star number in the appropriate place in the second column of the table below.
| Line Strength | Star Number | Spectral Class |
| Strongest line (greatest line area) | ||
| ↓ | ||
| ↓ | ||
| ↓ | ||
| ↓ | ||
| ↓ | ||
| Weakest line (least line area) |
Explore 3. Originally, astronomers classified those stars with the strongest hydrogen lines as ‘A’ stars, stars with the next strongest lines as ‘B’ stars, the next strongest ‘C’ and so on. Eventually, they realized that some letters were unnecessary, and dropped them from the classification system. The letter assigned to a star is called its spectral class.
The spectral classes that remain are: A, B, F, G, K, M, and O. In the third column of the table from Explore 2, write one of these spectral class letters for each star in the table, in that order (the strongest line is A, etc.). There is only one star of each class in this data.