
Colors like u-g and g-r give a way of measuring what colors of light an object gives off. Since SkyServer has magnitudes for hundreds of millions of objects, colors give you an easy way to learn something important about an object. But if you want to know more about the object, it helps to study the object in more detail by measuring a spectrum.
A spectrum (the plural is “spectra”) is a plot of the amount of light that an object gives off as a function of wavelength of light. A spectrum is like a fingerprint: just as each person has unique patterns in his or her fingerprints, each sky object has a unique spectrum.
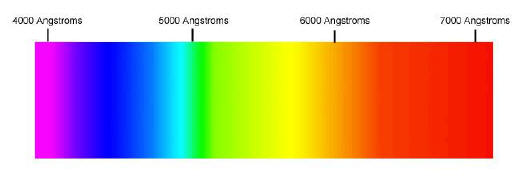
Sky objects give off light in a range of different colors. The color of light that you see is determined by the wavelength of the light wave. The wavelength is the distance from one peak of the wave to the next peak. The picture above shows how the color of light is related to its wavelength; the wavelength is shown in units called Angstroms (1 Angstrom = 0.0000000001, or 1 x 10⁻¹⁰, meters.)
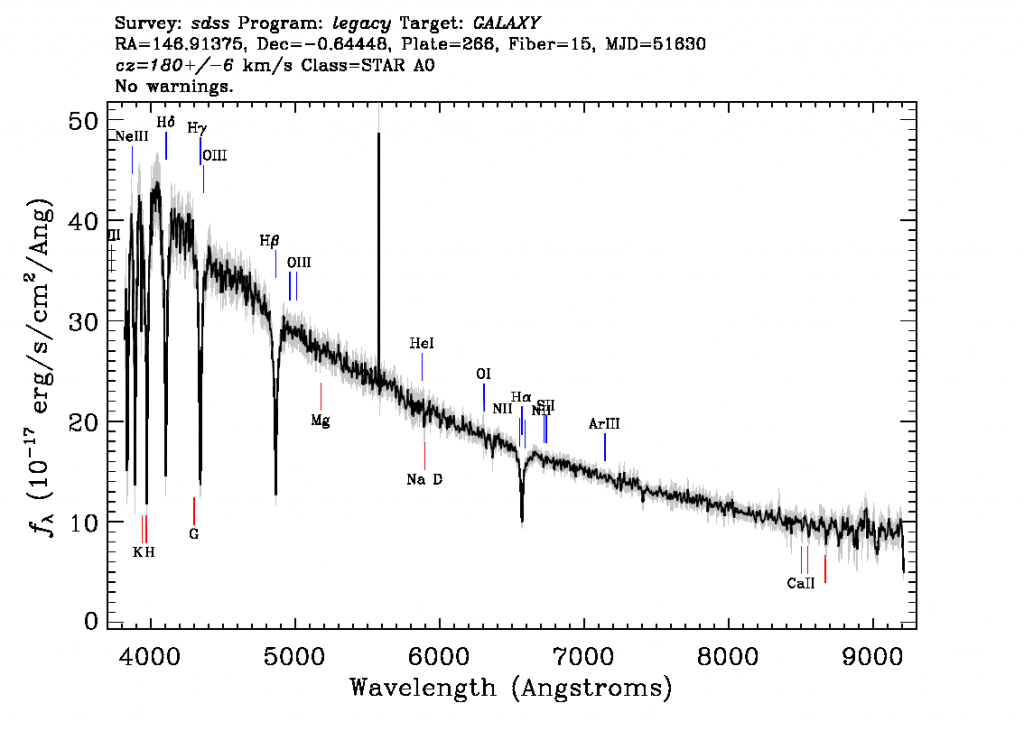
Sky objects do not give off the same amount of light at every wavelength. If you made a rainbow graph like the one above for a star or galaxy, some parts of the graph would be much brighter than others. Scientists used rainbow graphs for many years; but in the past 20 years, they have begun to use an x-y graph to show a star’s spectrum. The x-axis shows wavelength of light. The y-axis shows how bright the light is at that wavelength. Today, when scientists say “spectrum,” they usually mean this x-y graph.
The picture below shows a typical spectrum measured by the SDSS.
It takes about an hour to collect enough light to measure a spectrum. Because spectra are harder to measure than images and magnitudes, the SDSS has measured far fewer spectra. SkyServer has hundreds of millions of images, but less than one million spectra. However, a spectrum can give you more detailed information about an object than you can get with color alone.
Finding Spectra in SkyServer
If an object in the SDSS has a spectrum, a thumbnail view of the data will appear beneath the zoom-in image of the object on the right side of the SkyServer Navigate window.
Collecting and analyzing the spectrum of an object’s light is sometimes the only way to know exactly what type of object you are observing. Spectra in the SDSS are particularly useful for distinguishing between normal stars in our own galaxy and distant quasars (ultra-luminous accreting supermassive black holes in the centers of distant galaxies). While these two very different types of objects sometimes look identical in images, their spectra reveal strikingly different features, which makes it possible to tell them apart.
To review what spectra measure and how they can be used to determine the identity, composition, and distance to an object, please visit the Preflight Spectra page.

Click Next to learn more about how to look at spectra using SkyServer.