
For most small telescopes, your eye is the detector, but if your goal is to have survey information available for many scientists to use, then you need to record that information. In the case of the SDSS telescope, the two instruments that can be attached to the telescope to record the light are the CCD camera and the spectrographs. They record light in different ways.
The CCD Camera
Digital cameras are designed to record images. The recording surface of the camera is called a charged coupled device, or CCD. The CCD is a grid of tiny “light buckets” called pixels. The energy from the light striking the surface kicks off electrons which are then amplified, collected, and counted. The amount of charge produced by the light striking each pixel is recorded as a grid of numbers. When these numbers are read off in order, a computer can reconstruct digital images of the captured light.
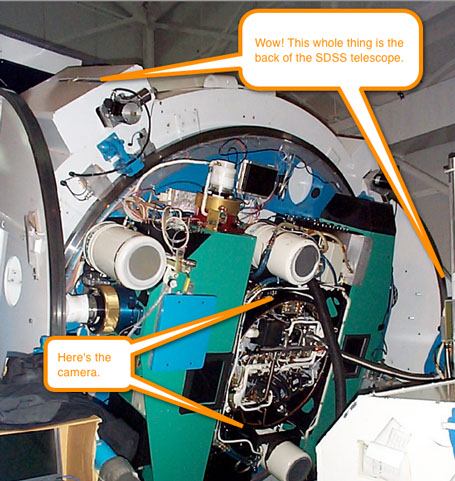
The job of any telescope is to collect and focus light. If you’re looking for a good analogy, try thinking of a telescope as a light funnel. A funnel collects liquid over a large area and focuses it through a much smaller opening. A great tool, of course, but you can imagine that a funnel wouldn’t be much good if you didn’t capture the liquid coming out at the other end. What a useless mess! The same thing is true for a telescope; we have to capture all of the light being gathered, focused, and directed through the back of the telescope.
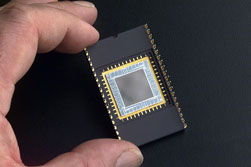
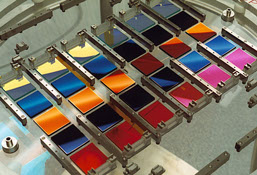
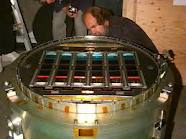
The SDSS camera has not one CCD but an array of 30 CCDs arranged in 6 columns of 5 chips each. Each of these 30 CCDs is many times the size of the one you find in a regular digital camera and has a grid of 2048 x 2048 pixels. That is 4,194,304 pixels for each CCD! Each row of CCDs is covered by a different filter that allows only certain wavelengths of light to pass through. Compare the single CCD from a home camera (left) to the 30 CCDs from the SDSS camera (center and right).
Unlike a typical camera, this one doesn’t snap a still picture. Instead, the telescope is parked in a given position, and as the Earth rotates, the sky moves over the camera from top to bottom. The electrons released by the incoming light are moved (or clocked) along the CCDs at the same rate that the sky moves over the camera, thereby ensuring that the signal is always gathered from the same objects. When a moving electron hits the edge of a CCD, it is read out through amplifiers. This readout is done continuously, resulting in long, skinny strips of sky imaged in one observation. Because the CCDs have spaces between them, to make a full picture, the telescope must be moved a little bit, and a second, slightly offset strip is imaged. A pair of strips is then combined into a single image called a stripe which has no empty areas.
The Spectrographs
A spectrograph, a prism-like device that disperses light into its many component colors, measures how much light objects emit at different wavelengths. This information, called a “spectrum,” can be used to analyze the distance, composition, and age of each celestial object. The SDSS spectrographs have a marvelous design which enables the spectra of 640 different objects to be recorded at one time. Upgrades to the spectrograph system in the most recent generation of the survey (SDSS-III) have increased this number to 1000!
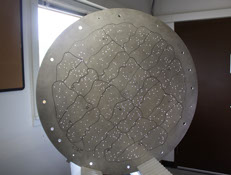
For each round of observations, interesting targets like galaxies, stars, and quasars are carefully chosen by astronomers from the images taken previously with the CCD camera. SDSS engineers drill up to 1000 holes into an aluminum plate in such a way that they will precisely line up with the locations of the targets when the plate is attached to the telescope and pointed at the sky. A fiber optic cable is inserted into each hole and connected to the spectrograph. These cables simultaneously gather light from up to 1000 individual objects and send it to the two spectrographs.
When the light from each cable enters the spectrograph, it is split into its composite colors much the same way a prism separates visible light into its rainbow. The resulting spectra are then recorded using CCDs. Each spectrum is measured from 3800 Angstroms (blue) to 9200 Angstroms (near-infrared) on 2048 x 2048 pixel CCDs.
The plug plates are placed at the focal plane of the telescope, just like the CCD camera. On a good night, SDSS astronomers will use six to nine plates, obtaining spectra for up to 5,000 objects!
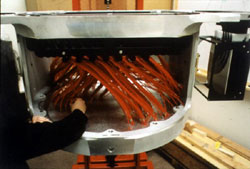
Below you see two pictures. One shows a plate, removed from the spectrograph and held up to the light revealing the locations of each of the holes. In the second picture, the plate is lying horizontally in the spectrograph. You can see the red optical fibers running from the plate up to a specific location in the spectrograph. Although the plate looks large, it covers an area of the sky that is only 3 degrees in diameter. That is equal to the width of your index and middle fingers held at arm’s length.
For more information about how the original spectrograph worked, visit this page on the SDSS website. The spectrograph was upgraded in 2008 for the SDSS-III BOSS Survey. All of the details of the upgraded spectrograph can be found here.
If you want to understand more about the products of each of these instruments and how to access them in SkyServer, explore
Pre-Flight SDSS Data.